Nephrology: Translational
Category: Abstract Submission
Nephrology I: Potpourri
99 - Nuclear RNA-seq reveals the porcine kidney's molecular signature in early autosomal dominant polycystic kidney disease
Friday, April 22, 2022
6:15 PM - 8:45 PM US MT
Poster Number: 99
Publication Number: 99.138
Publication Number: 99.138
Laurel Willig, University of Missouri-Kansas City School of Medicine, Kansas City, MO, United States; Darren P. Wallace, University of Kansas School of Medicine, Kansas City, KS, United States; Christopher Rogers, Precigen Exemplar, Coralville, IA, United States; WARREN A. CHEUNG, Children's Mercy Hospital, Kansas City, MO, United States; Tomi Pastinen, Children's Mercy Hospitals and Clinics, Kansas City, MO, United States

Laurel Willig, MD, MS (she/her/hers)
Pediatric Nephrology, Associate Professor
Children’s Mercy Kansas City
Kansas City, Missouri, United States
Presenting Author(s)
Background: Autosomal dominant polycystic kidney disease (ADPKD) is the most common genetic cause of end stage renal disease and is characterized by the formation of numerous cysts within the kidneys. Renal cyst formation begins in utero, however, most studies of cystic disease are performed using tissues obtained from end-staged ADPKD kidneys or animal models that do not mimic the molecular genetic disease of humans.
Objective: We utilized a porcine model of ADPKD, which more closely approximates human genetic disease, to explore early transcriptional changes in cystic kidneys compared to age-matched controls to increase understanding of mechanisms responsible for cystogenesis and early disease.
Design/Methods: Samples included 2 PKD1+/-cystic kidney regions, 2 PKD1+/- minimally affected (MA) kidney regions, one wildtype control and one hypomorphic sample with no cysts. Single cell nuclear RNA-sequencing (snRNA-Seq) was performed using 10X Chromium Genomics technology. We characterized 3076 wildtype cells, 3834 cells from the hypomorphic kidney, 12851 cells for cystic areas and 8855 cells from minimally affected areas. We used Cell Ranger for initial alignment. Seurat v4 was used for integration and clustering with SLM modularity optimization. Graphic visualization of the clustering was done using UMAP. Differential expression was done using the Wilcoxon Rank Sum test, excluding the hypomorphic sample in this analysis. Preliminary gene set enrichment analysis was performed using GSEA software (Broad Institute, Inc).
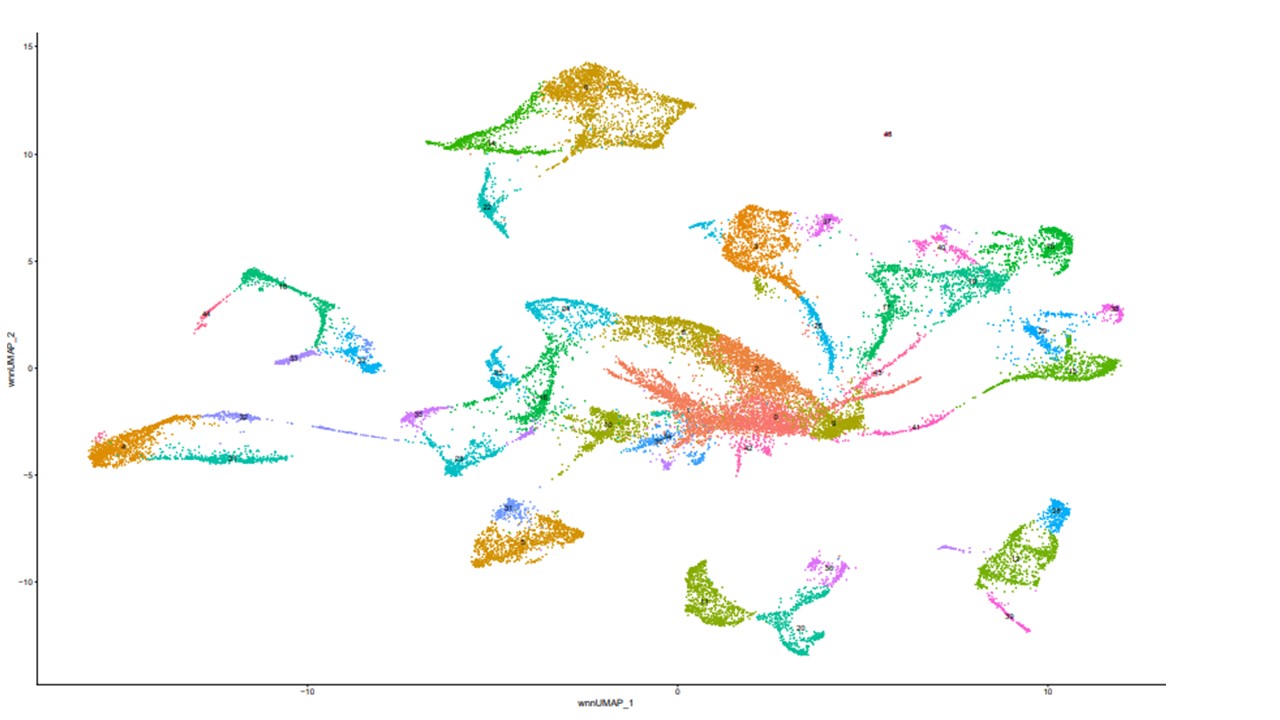
Results: Eighteen out of forty-four clusters were definitively identified as part of renal tubule using marker genes (Figure 1). PKD1 was not differentially expressed between cystic tissue and controls or cystic tissue and MAT, consistent with previous bulk RNA-seq studies. Within the 17 clusters, 40 genes were downregulated in PKD1+/- cystic areas compared to controls and 663 genes were upregulated in PKD1+/- cystic areas compared to controls. There were 110 downregulated genes in cystic compared to MA and 673 genes were upregulated in PKD1+/- compared to MA. Gene ontology results using GSEA for genes upregulated and downregulated in PKD1+/- compared to wildtype and MAT are presented in Figure 2 and Figure 3 respectively.Conclusion(s): This study provides early characterization of porcine PKD1+/- cell populations using snRNA-Seq and provides a preliminary look at differential gene expression within the tubular cells between wildtype and PKD1+/-, cystic and MAT.
Figure 1: Clustering of 6 samples following integration and clustering with Seurat. 17 clusters were identified using marker genes as belonging to the renal tubular compartment. These clusters include the following: 2, 3, 8, 9, 13-19, 24-26, 29, 37, 38, and 43.
Figure 2: Gene Set Enrichment Analysis (GSEA) of genes upregulated in PKD1+/- tissue compared to wildtype or minimally affected tissue..jpg) Gene ontology terms associated with genes that are upregulated in PKD1 +/- tissue compared to either wildtype tissue, minimally affected tissue from PKD1 +/- pigs, or in genes upregulated in both comparisons (ie genes upregulated in the PKD1+/- tissue in both analyses).
Gene ontology terms associated with genes that are upregulated in PKD1 +/- tissue compared to either wildtype tissue, minimally affected tissue from PKD1 +/- pigs, or in genes upregulated in both comparisons (ie genes upregulated in the PKD1+/- tissue in both analyses).
Objective: We utilized a porcine model of ADPKD, which more closely approximates human genetic disease, to explore early transcriptional changes in cystic kidneys compared to age-matched controls to increase understanding of mechanisms responsible for cystogenesis and early disease.
Design/Methods: Samples included 2 PKD1+/-cystic kidney regions, 2 PKD1+/- minimally affected (MA) kidney regions, one wildtype control and one hypomorphic sample with no cysts. Single cell nuclear RNA-sequencing (snRNA-Seq) was performed using 10X Chromium Genomics technology. We characterized 3076 wildtype cells, 3834 cells from the hypomorphic kidney, 12851 cells for cystic areas and 8855 cells from minimally affected areas. We used Cell Ranger for initial alignment. Seurat v4 was used for integration and clustering with SLM modularity optimization. Graphic visualization of the clustering was done using UMAP. Differential expression was done using the Wilcoxon Rank Sum test, excluding the hypomorphic sample in this analysis. Preliminary gene set enrichment analysis was performed using GSEA software (Broad Institute, Inc).
Results: Eighteen out of forty-four clusters were definitively identified as part of renal tubule using marker genes (Figure 1). PKD1 was not differentially expressed between cystic tissue and controls or cystic tissue and MAT, consistent with previous bulk RNA-seq studies. Within the 17 clusters, 40 genes were downregulated in PKD1+/- cystic areas compared to controls and 663 genes were upregulated in PKD1+/- cystic areas compared to controls. There were 110 downregulated genes in cystic compared to MA and 673 genes were upregulated in PKD1+/- compared to MA. Gene ontology results using GSEA for genes upregulated and downregulated in PKD1+/- compared to wildtype and MAT are presented in Figure 2 and Figure 3 respectively.Conclusion(s): This study provides early characterization of porcine PKD1+/- cell populations using snRNA-Seq and provides a preliminary look at differential gene expression within the tubular cells between wildtype and PKD1+/-, cystic and MAT.
Figure 1: Clustering of 6 samples following integration and clustering with Seurat.
 17 clusters were identified using marker genes as belonging to the renal tubular compartment. These clusters include the following: 2, 3, 8, 9, 13-19, 24-26, 29, 37, 38, and 43.
Figure 2: Gene Set Enrichment Analysis (GSEA) of genes upregulated in PKD1+/- tissue compared to wildtype or minimally affected tissue.
.jpg) Gene ontology terms associated with genes that are upregulated in PKD1 +/- tissue compared to either wildtype tissue, minimally affected tissue from PKD1 +/- pigs, or in genes upregulated in both comparisons (ie genes upregulated in the PKD1+/- tissue in both analyses).
Gene ontology terms associated with genes that are upregulated in PKD1 +/- tissue compared to either wildtype tissue, minimally affected tissue from PKD1 +/- pigs, or in genes upregulated in both comparisons (ie genes upregulated in the PKD1+/- tissue in both analyses).