
Neonatal Neurology: Basic
Category: Abstract Submission
Neurology 3: Basic-Translational
 photo")
Thomas R. Wood, MD, PhD (he/him/his)
Assistant Professor
University of Washington School of Medicine
Seattle, Washington, United States
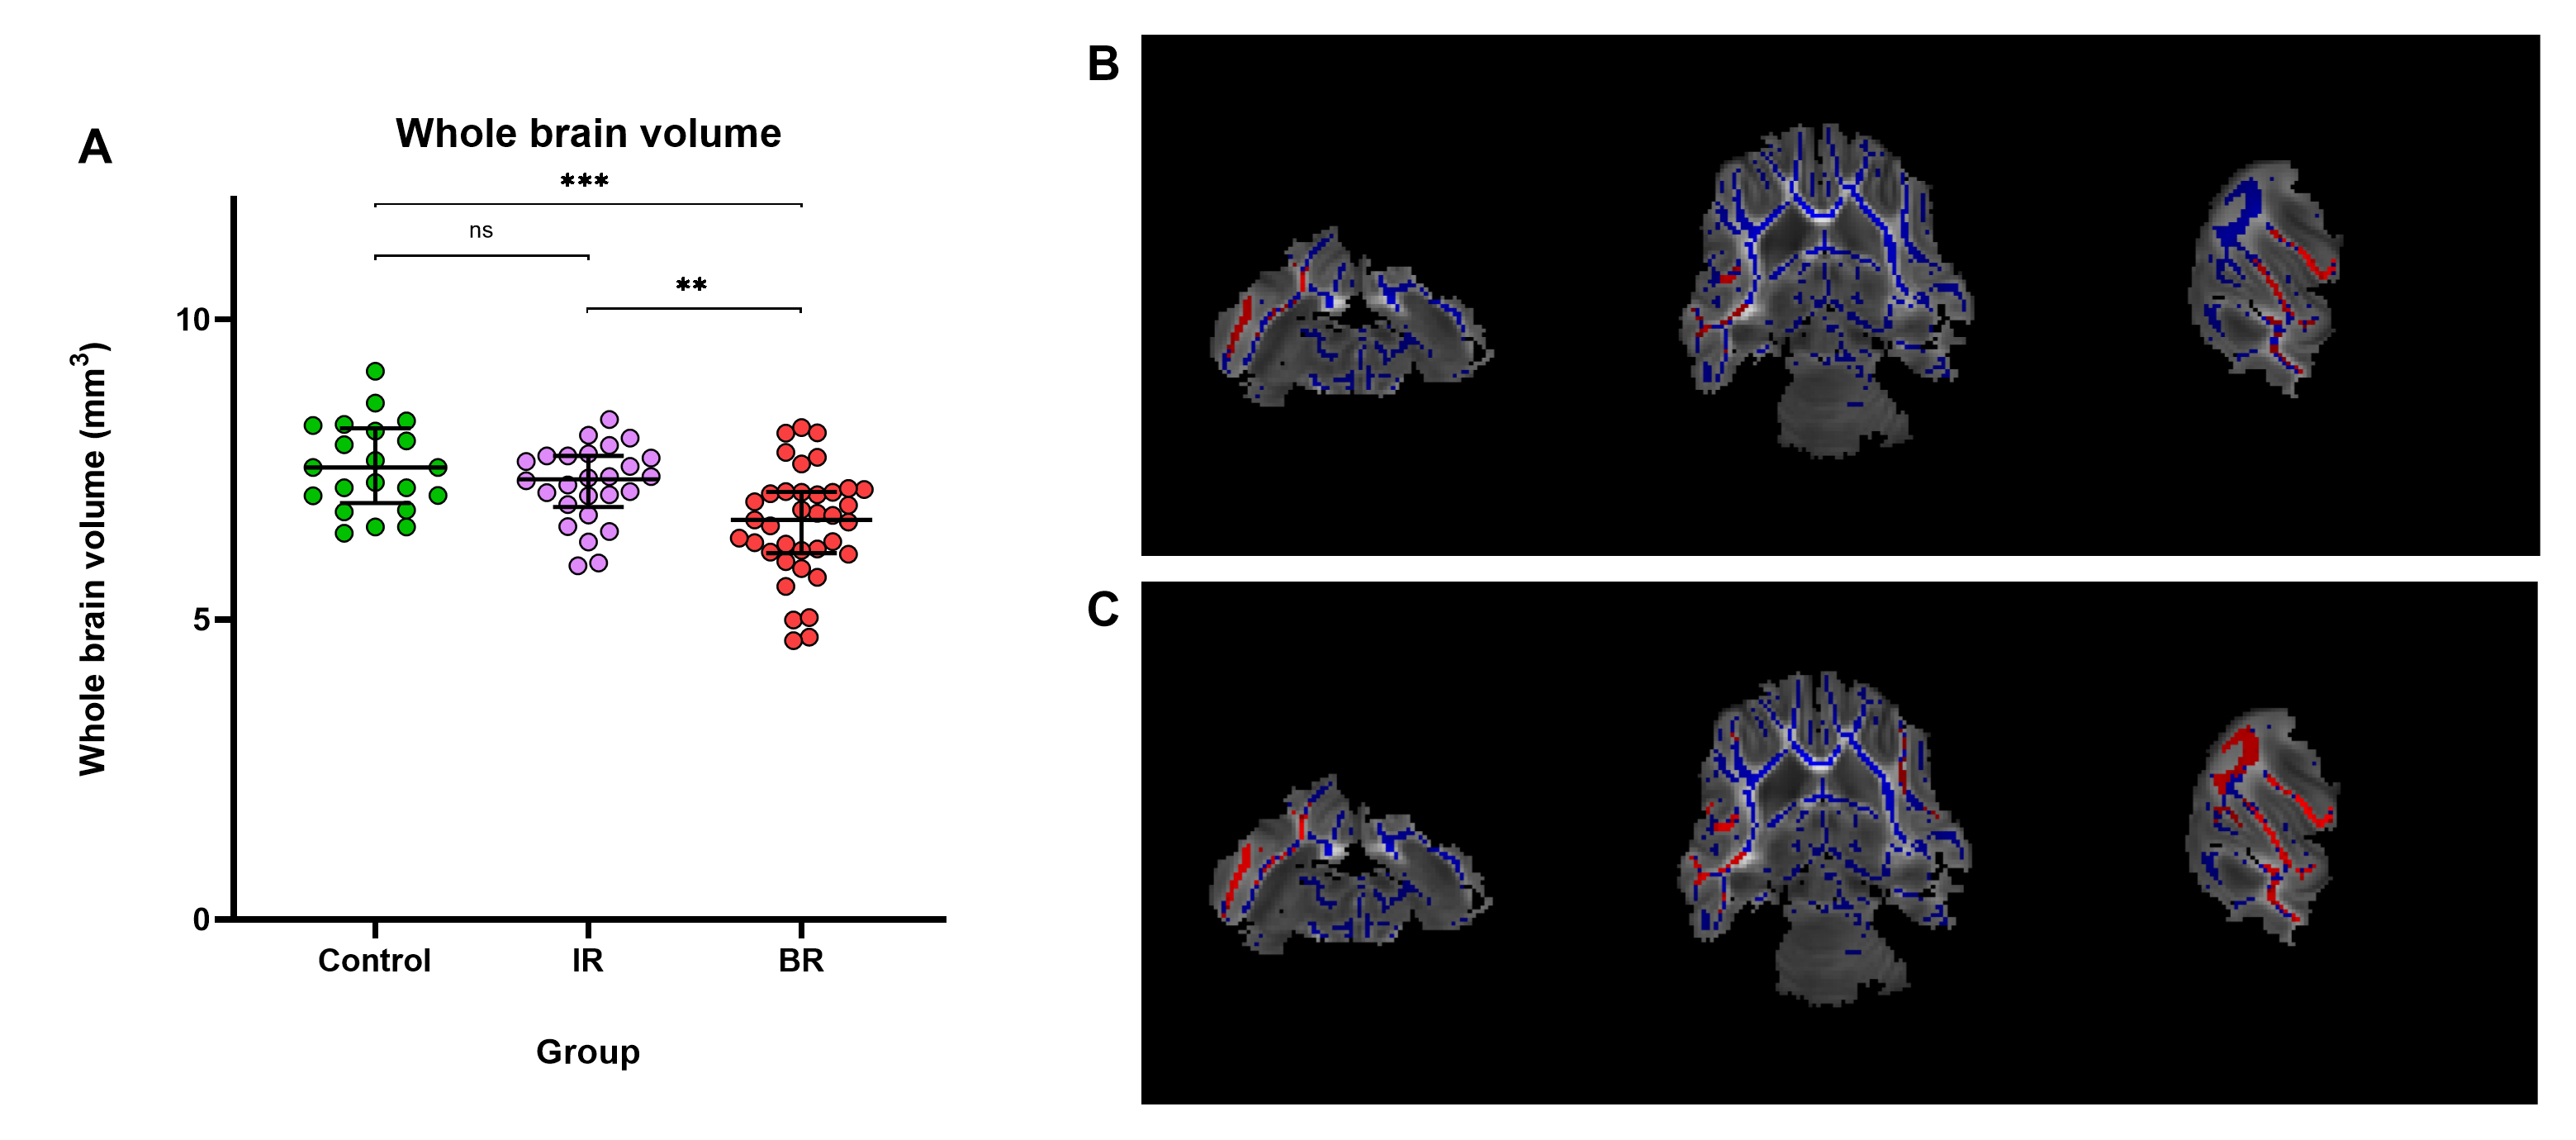 Comparisons of total brain volume and fractional anisotropy (FA) values throughout the white matter (blue). Red indicates significantly different FA values between IR and BR brains after threshold-free cluster enhancement (TFCE) adjustment for multiple comparisons. (A) The median and IQR are plotted on the graph. Analysis of whole brain volumetrics showed that BR brains had significantly decreased brain volumes when compared to IR and control brains. (B) At a significance level of 0.05, BR brains had significantly reduced FA unilaterally in the right posterior cerebral white matter tracts adjacent to the hippocampus. (C) At a significance level of 0.10, BR brains had significantly reduced FA bilaterally throughout the anterior and posterior cerebral white matter. ** Denotes p–value < 0.01, *** denotes p-value < 0.001, and ns denotes no significant difference.
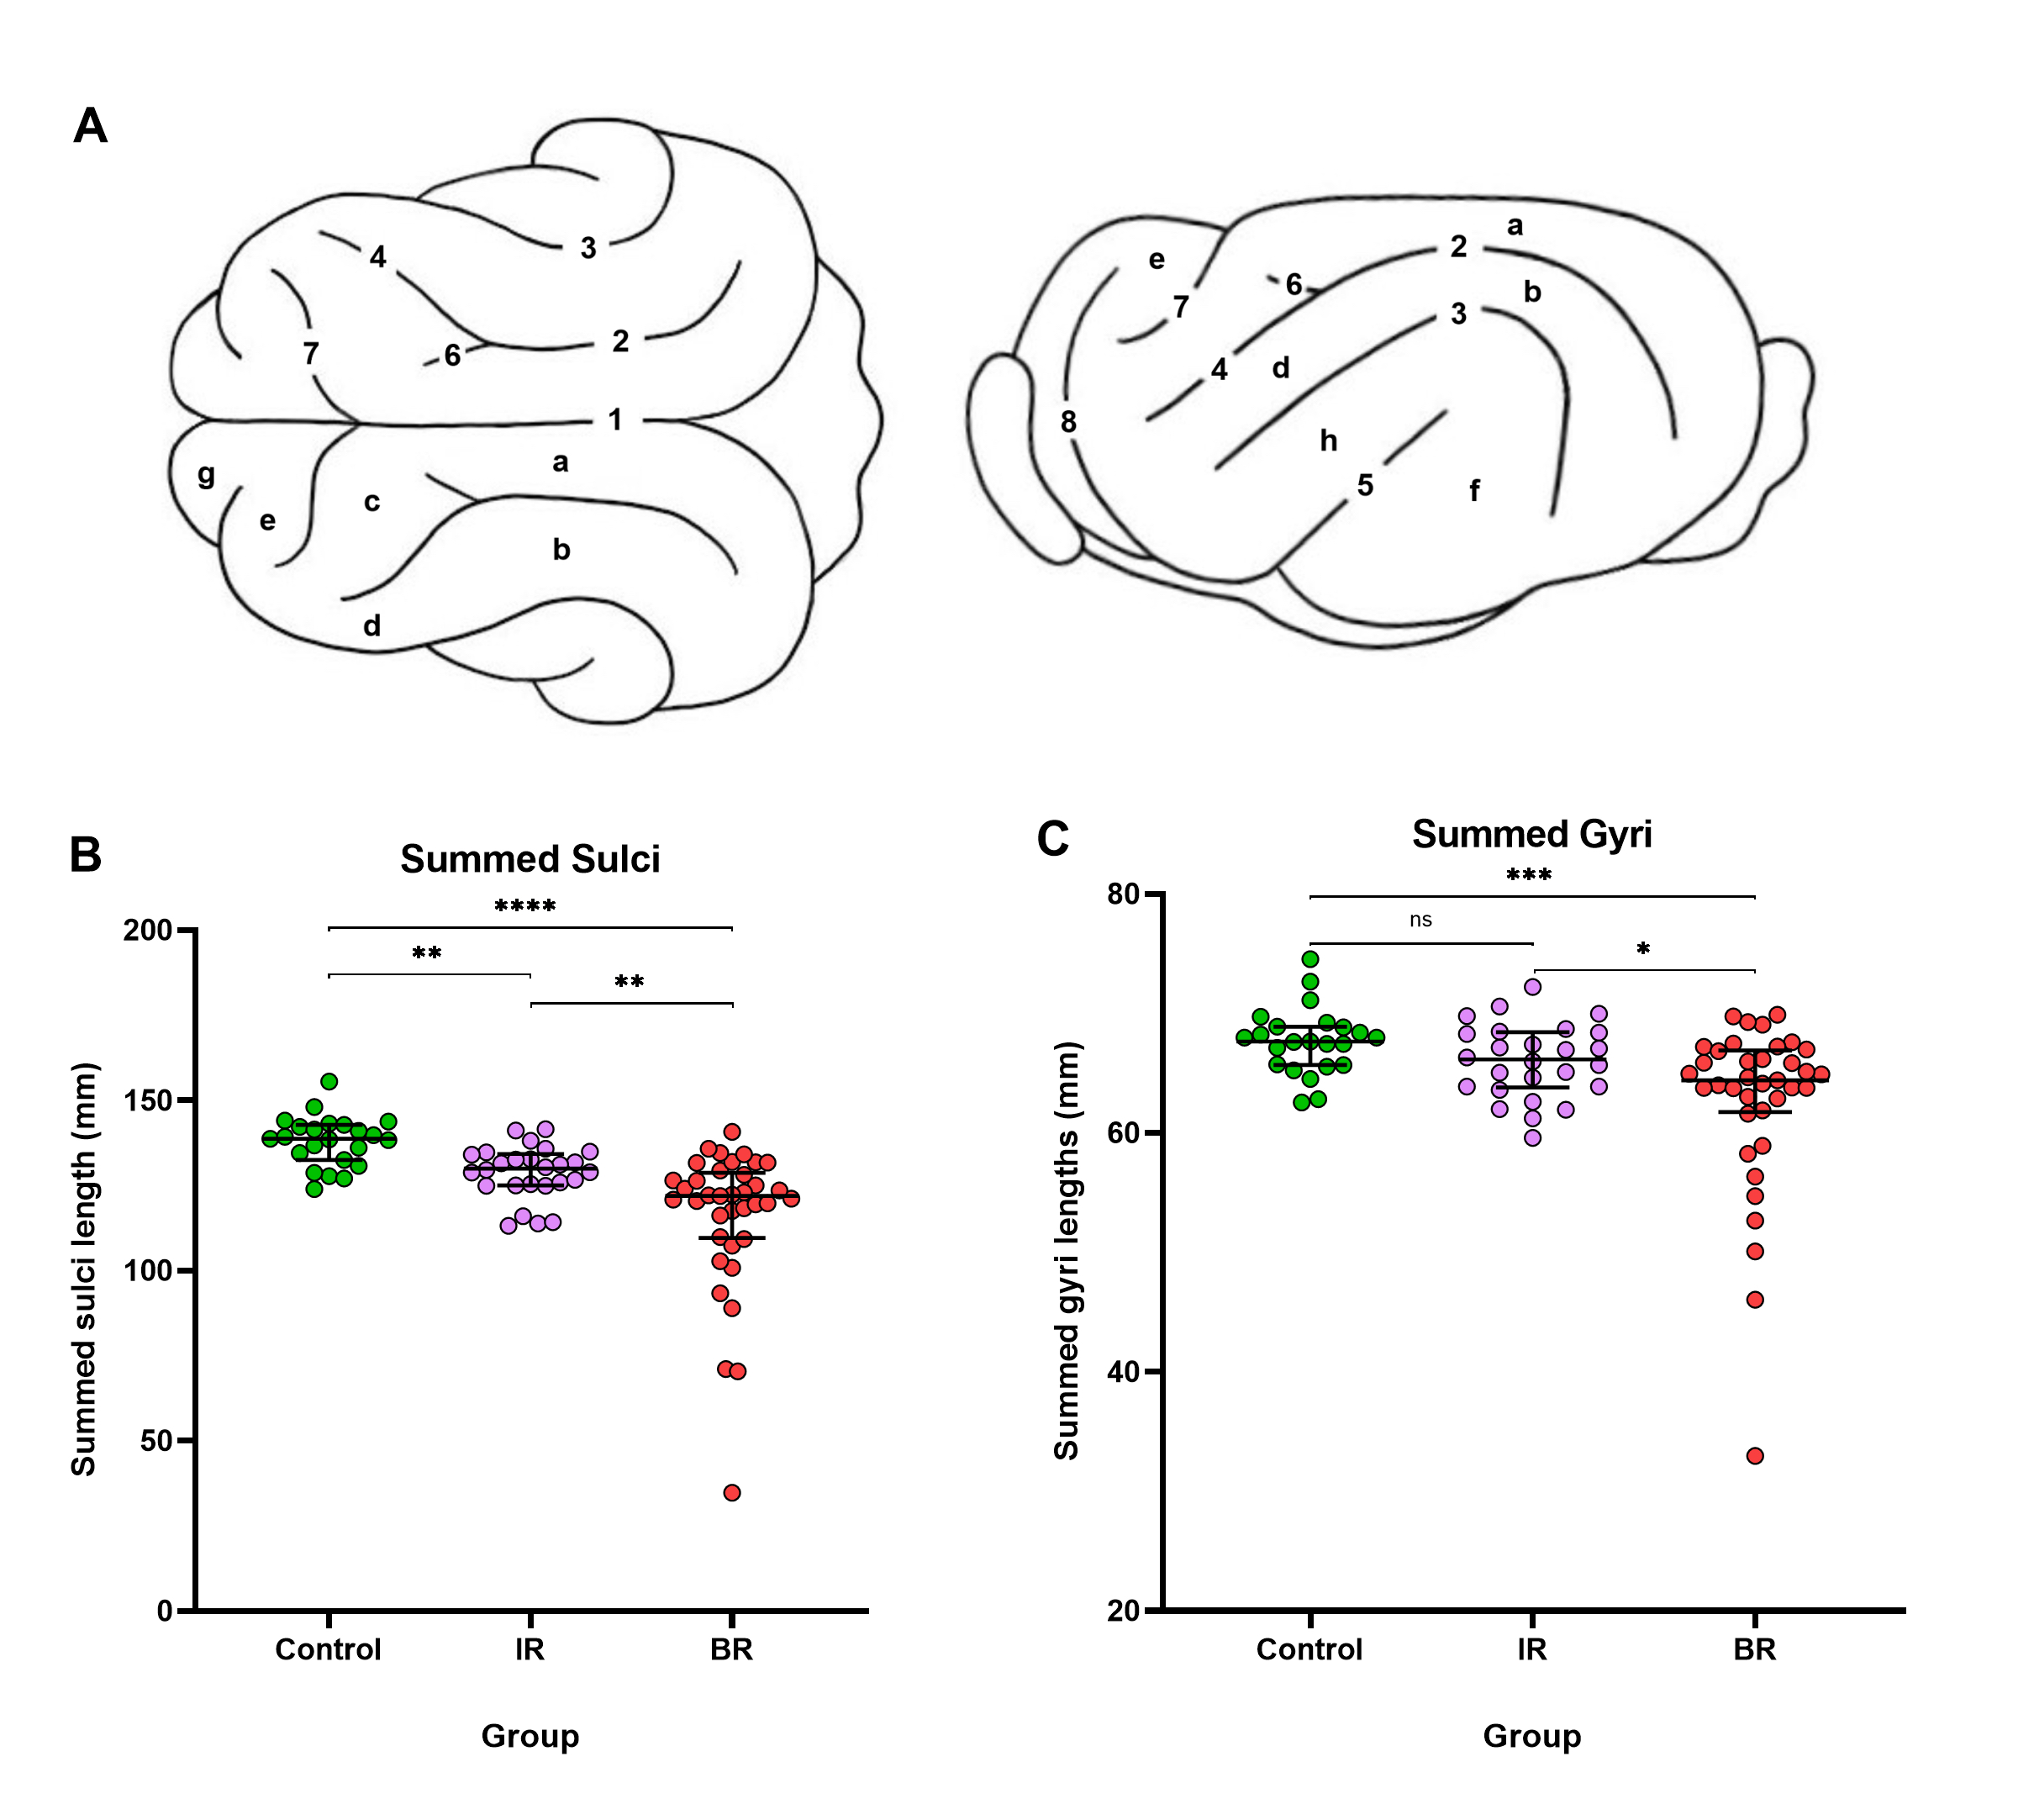 The median and IQR are plotted on each graph. (A) Ferret brain atlas depicting: 1. Longitudinal Fissure, 2. Lateral Sulcus, 3. Suprasylvian Sulcus, 4. Coronal Sulcus, 5. Pseudosylvian Sulcus, 6. Ansinate Sulcus, 7. Cruciate Sulcus, 8. Presylvian Sulcus, a. Lateral Gyrus, b. Suprasylvian Gyrus, c. Posterior Sigmoid Gyrus, d. Coronal Gyrus, e. Ectosylvian Gyrus, g. Orbital Gyrus, i. Cerebellum exposed. (B) Summed sulci length in control brains compared to HI brains. After summing the length of each sulcus, IR and BR brains had significantly shorter sulci compared to control brains. IR brains displayed a significant improvement in summed totals of all sulcal lengths when compared to BR brains. (C) Summed gyri length in control brains relative to HI brains. BR brains had significantly narrower summed totals of all gyral widths when compared to IR and BR brains. * Denotes p–value < 0.05, ** denotes p–value < 0.01, *** denotes p-value < 0.001, **** denotes p-value < 0.0001, and ns denotes no significant difference.