Infectious Diseases
Category: Abstract Submission
Infectious Diseases: Respiratory Viruses
582 - Monthly Variability and Climatic Factors Associated with Human Rhinovirus/Enterovirus Nasopharyngeal Sample Positivity on Oahu, Hawai’i from 2016-2019
Monday, April 25, 2022
3:30 PM - 6:00 PM US MT
Poster Number: 582
Publication Number: 582.417
Publication Number: 582.417
Raymundo Z. Marcelo, Tripler Army Medical Center, Kaneohe, HI, United States; Milissa Jones, Tripler Army Medical Center, Honolulu, HI, United States; Michael Lustik, Tripler Army Medical Center, Honolulu, HI, United States

Raymundo Z. Marcelo, Jr., MD
Pediatric Resident
Tripler Army Medical Center
Kaneohe, Hawaii, United States
Presenting Author(s)
Background: Globally, Human Rhinoviruses (HRV-ENT), part of the Enterovirus genus, are the leading cause of the common cold and are indistinguishable from other Enteroviruses on many widely available molecular platforms. Although transmitted year-round, both geographic and climatic factors impact peak activity. In temperate climates, peak activity of HRV-ENT occurs during autumn and spring. In tropical climates, such as Hawai’i (HI), HRV-ENT are thought to peak during the rainy season, however data remain limited.
Objective: Describe the seasonality of HRV-ENT and evaluate climatic factors associated with peak activity among respiratory viral samples processed on Oahu, HI.
Design/Methods: We conducted a retrospective analysis of all respiratory specimens submitted to Tripler Army Medical Center for multiplex polymerase chain reaction (PCR) testing between May 2016 and May 2019. Among samples positive for HRV-ENT, we recorded both month and year of positivity. An annual positive detection rate (PDR) was calculated and peak months were defined by a PDR above the mean. Poisson regression was used to evaluate associations between temperature, precipitation levels, relative humidity, and wind speed by week and the number of positive samples for HRV-ENT.
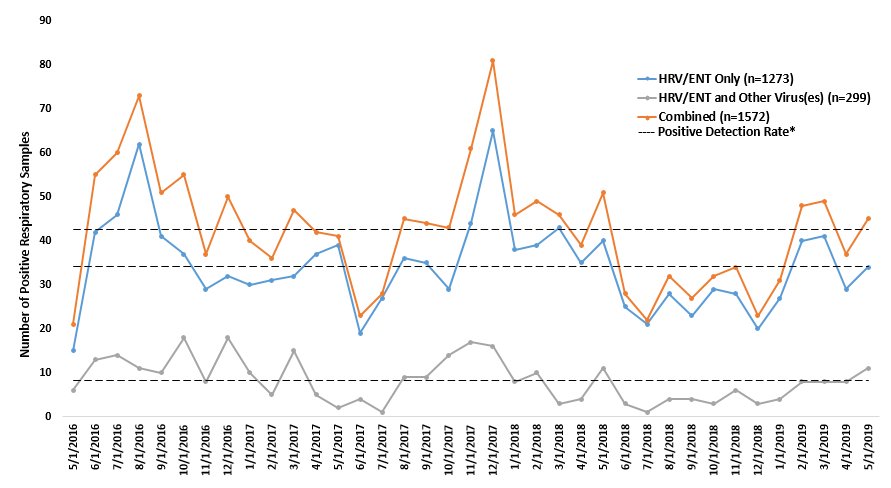
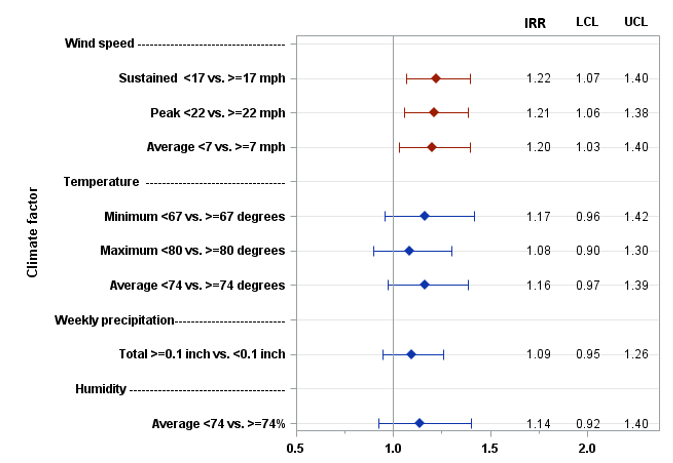
Results: During our study period there were 7,143 respiratory samples received for multiplex PCR testing, with 1,572 positive for HRV-ENT (22%), 19% of which were additionally positive for one or more respiratory pathogens. The majority of HRV-ENT positive samples arose from children < 5 years of age (n=959, 61%). Peak months were August, December, February, and March with co-infections accounting for additional small peaks in October and November (Figure 1). After controlling for lagged count and year, wind speed (sustained, peak, and average) was the only climatic factor significantly associated with HRV-ENT sample positivity (Figure 2).Conclusion(s): In our analysis we observed a difference in the peak monthly activity of HRV-ENT compared to temperate climates, most notably peaks during December and February (winter months). Coinfections did not appear to impact peak activity of HRV-ENT. We did not observe an association between precipitation and peak HRV-ENT activity as previously described in tropical climates. Wind speed was associated with increased weekly HRV-ENT positivity and should be further explored as a transmission factor. Our study contributes to the understanding of the annual variability of HRV-ENT activity in tropical environments which can inform clinician expectations regarding respiratory viral symptomatology in Pediatric practice in this region.
Monthly Variability and Peak Annual Activity of Human Rhinovirus/Enterovirus (HRV-ENT) Identified By Multiplex Polymerase Chain Reaction Testing on Oahu, Hawai’i from 2016-2019. Monthly multiplex PCR respiratory samples positive for HRV-ENT were plotted from May 2016 to May 2019. An annual positive detection rate (PDR) was calculated and peak months were defined by a PDR above the mean.
Association Between Weekly Climatic Factors and Human Rhinovirus/Enterovirus (HRV-ENT) Detection Among Respiratory Samples on Oahu, Hawai’i from 2016-2019. Abbreviations: IRR- Incidence Rate Ratios; LCL- lower confidence limit; UCL-upper confidence limit
Poisson regression was used to calculate incidence rate ratios of HRV-ENT positivity in association with multiple climatic factors including wind speed (sustained, peak, and average), temperature (minimum, maximum, and average), weekly precipitation, and humidity. Model was adjusted for the lag count and year. Significant associations are indicated in red.
Objective: Describe the seasonality of HRV-ENT and evaluate climatic factors associated with peak activity among respiratory viral samples processed on Oahu, HI.
Design/Methods: We conducted a retrospective analysis of all respiratory specimens submitted to Tripler Army Medical Center for multiplex polymerase chain reaction (PCR) testing between May 2016 and May 2019. Among samples positive for HRV-ENT, we recorded both month and year of positivity. An annual positive detection rate (PDR) was calculated and peak months were defined by a PDR above the mean. Poisson regression was used to evaluate associations between temperature, precipitation levels, relative humidity, and wind speed by week and the number of positive samples for HRV-ENT.
Results: During our study period there were 7,143 respiratory samples received for multiplex PCR testing, with 1,572 positive for HRV-ENT (22%), 19% of which were additionally positive for one or more respiratory pathogens. The majority of HRV-ENT positive samples arose from children < 5 years of age (n=959, 61%). Peak months were August, December, February, and March with co-infections accounting for additional small peaks in October and November (Figure 1). After controlling for lagged count and year, wind speed (sustained, peak, and average) was the only climatic factor significantly associated with HRV-ENT sample positivity (Figure 2).Conclusion(s): In our analysis we observed a difference in the peak monthly activity of HRV-ENT compared to temperate climates, most notably peaks during December and February (winter months). Coinfections did not appear to impact peak activity of HRV-ENT. We did not observe an association between precipitation and peak HRV-ENT activity as previously described in tropical climates. Wind speed was associated with increased weekly HRV-ENT positivity and should be further explored as a transmission factor. Our study contributes to the understanding of the annual variability of HRV-ENT activity in tropical environments which can inform clinician expectations regarding respiratory viral symptomatology in Pediatric practice in this region.
Monthly Variability and Peak Annual Activity of Human Rhinovirus/Enterovirus (HRV-ENT) Identified By Multiplex Polymerase Chain Reaction Testing on Oahu, Hawai’i from 2016-2019.
 Monthly multiplex PCR respiratory samples positive for HRV-ENT were plotted from May 2016 to May 2019. An annual positive detection rate (PDR) was calculated and peak months were defined by a PDR above the mean.
Association Between Weekly Climatic Factors and Human Rhinovirus/Enterovirus (HRV-ENT) Detection Among Respiratory Samples on Oahu, Hawai’i from 2016-2019.
 Abbreviations: IRR- Incidence Rate Ratios; LCL- lower confidence limit; UCL-upper confidence limit
Poisson regression was used to calculate incidence rate ratios of HRV-ENT positivity in association with multiple climatic factors including wind speed (sustained, peak, and average), temperature (minimum, maximum, and average), weekly precipitation, and humidity. Model was adjusted for the lag count and year. Significant associations are indicated in red.
