
Neonatal General
Category: Abstract Submission
Neonatology General 9: Congenital Anomalies - CV
 photo")
Karen Fairchild, MD (she/her/hers)
Professor of Pediatrics
University of Virginia School of Medicine
Charlottesville, Virginia, United States, Virginia, United States
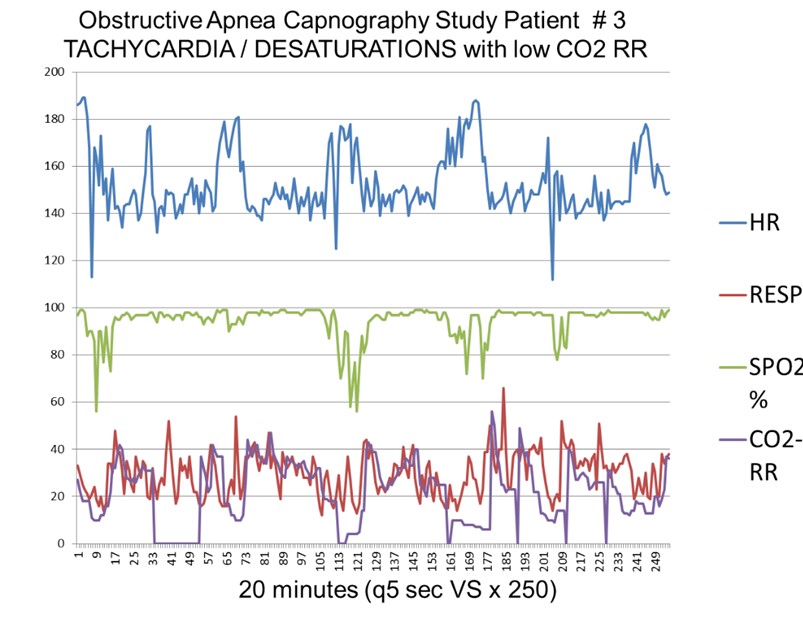 In this 20 minute tracing from a capnography study, OA is evidenced by exhaled CO2-Respiratory Rate (purple) declining toward zero while the chest impedance respiratory rate (red) does not indicate central apnea. There are several episodes of OA with HR (blue) increasing by more than 30 beats/minute and SpO2 decreasing to < 80%.
.png) Median number of daily BDs (top) and TDs (bottom) by GA (y axis 24-39 weeks bottom to top) and PMA (x axis 24-39 weeks left to right). The heat map color scale goes from lowest in blue (0 episodes/day) to highest in red (6 episodes/day). Number of infants with data analyzed at each GA and PMA is indicated in the boxes.
Median number of daily BDs (top) and TDs (bottom) by GA (y axis 24-39 weeks bottom to top) and PMA (x axis 24-39 weeks left to right). The heat map color scale goes from lowest in blue (0 episodes/day) to highest in red (6 episodes/day). Number of infants with data analyzed at each GA and PMA is indicated in the boxes.