Back
Health Services Research
Category: Abstract Submission
Health Services Research III
2 - Changing volume and indication for pediatric admissions across the COVID pandemic
Monday, April 25, 2022
3:30 PM – 6:00 PM US MT
Poster Number: 2
Publication Number: 2.414
Publication Number: 2.414
Daria C. Murosko, Childrens Hospital of Philadelphia, Philadelphia, PA, United States; Molly Passarella, Childrens Hospital of Philadelphia, Philadelphia, PA, United States; Scott A. Lorch, Perelman School of Medicine at the University of Pennsylvania, Philadelphia, PA, United States

Daria C. Murosko, MD MPH
Neonatal Fellow
Childrens Hospital of Philadelphia
The Children's Hospital of Philadelphia
Philadelphia, Pennsylvania, United States
Presenting Author(s)
Background: Since the COVID-19 pandemic began, pediatric healthcare has been influenced by unique pressures and societal trends, from shifting policies on physical distancing and school closures to roll-out of vaccinations. These forces have varied temporally over the course of the pandemic and may have differentially affected health care use of children of different age groups.
Objective: To determine how admission volumes and diagnoses changed longitudinally during the COVID-19 era for different age groups.
Design/Methods: This retrospective cohort study used the Pediatric Hospital Information System database to analyze inpatient admissions of children aged 1 day to 18 years (n= 1,624,755) across 45 Children’s Hospitals from 1/1/17 to 6/30/21. Birth hospitalizations and interhospital transfers were excluded. Admitting diagnoses were grouped using Clinical Classification Software Refined (CCSR) categories. Respiratory infections and mental health disorders were developed from related CCSR designations. Using binomial probability tests, admissions and diagnoses counts in the COVID-19 era (March 2020 - June 2021) were compared to the averaged counts from the same months from 2017 – 2019 (pre-COVID-19 era) to account for secular trends. Change over the pandemic was evaluated with multivariate linear regression adjusting for age group.
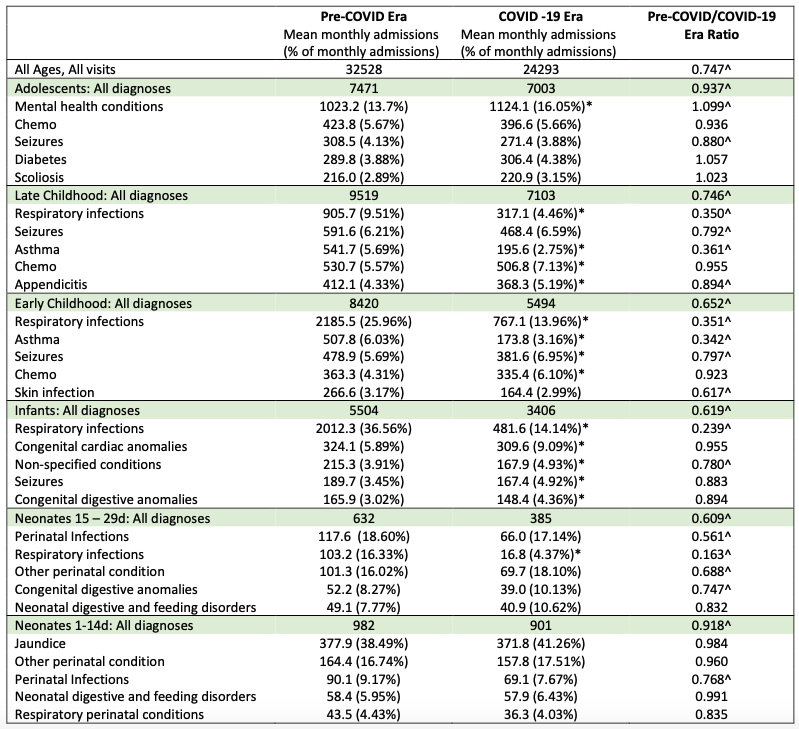
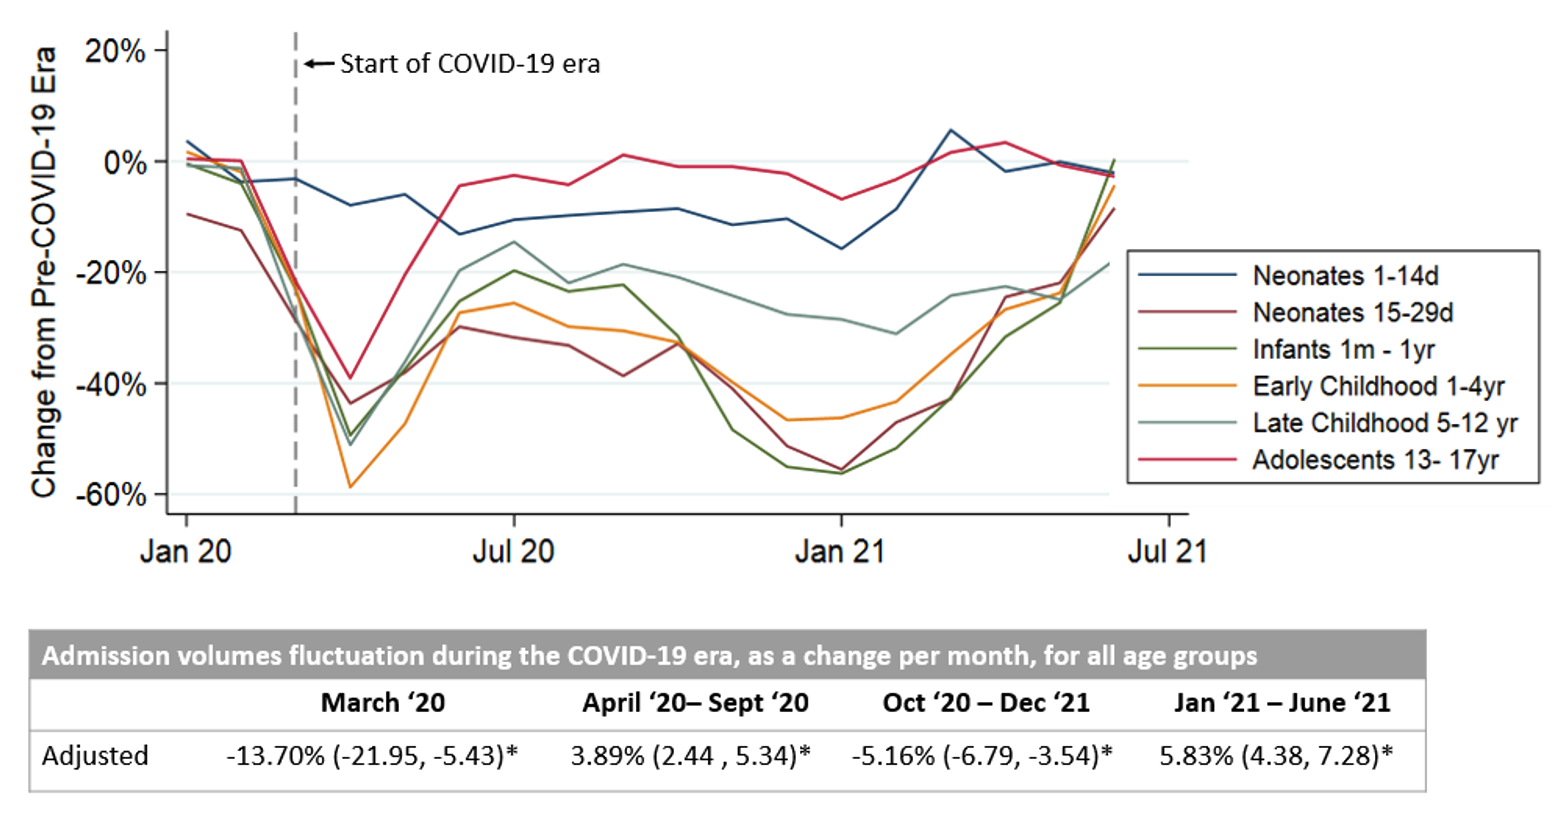
Results: There were small, statistically significant differences in demographic data between the pre- and post-pandemic cohorts, such as slightly increased proportion of patients who are White, female and self-paying. Overall, average monthly admissions declined by 25.3% in the COVID-19 era compared to the pre-pandemic period (Table 1), but this varied temporally over the duration of the pandemic for all age groups (Figure 1). Compared to newborns in our adjusted model, adolescents had a similar decline in their admissions over the duration of pandemic (0.55% difference, 95% CI: –5.29, 6.39). Other age groups experienced an 18.7 – 26.9% greater decline in admissions compared to newborns. In the 1,623,244 patients with a CCSR code, there was a 68.4% (p < 0.001) decrease in respiratory infections. Adolescents experienced a marked increase in mental health conditions (9.9%, p < 0.001) and eating disorders (72.4%, p < 0.001) (Figure 2).Conclusion(s): The overall decline seen in admissions during the COVID-19 era is driven by reduced cases of respiratory pathogens. In adolescents, this decline is counterbalanced by the dramatic increase in mental health conditions. Newborns continue to be mostly admitted for birth-related conditions, resulting in volume stability during the COVID-19 era.
Table 1: Admission volumes and top 5 most frequent CCSR categories, by age group Abbreviations: CCSR – Clinical Classification Software Refined.
To obtain mean monthly admissions, counts are summed over the entire era (pre-pandemic or COVID) and then averaged over the number of months in that period. The % of monthly admissions is the observed count of a specific diagnosis divided by the average monthly admission for that age group and that era. *p < 0.05 for the comparison of the proportion of a given diagnoses within an age group in the pre- vs post-COVID-19 eras.
The inter-era difference ratios were calculated by averaged counts during the pandemic divided by averaged counts in pre-COVID-19 era. ^p < 0.05 for the difference in absolute admissions in the pre- vs post-COVID-19 eras. A ratio of 1 indicates no change in admission counts between eras. Ratio < 1 means that average counts were higher in the pre-pandemic era; a ratio > 1 means that average counts were higher during the pandemic.
Figure 1: Change in inpatient admissions during the COVID-19 era for all age groups *Indicates that p < 0.05. Percent change in admissions was calculated by difference in monthly admission counts during the COVID-19 era divided by the average monthly admission counts in the pre-COVID-19 era. A negative number indicates a decrease in admissions during the COVID-19 era. There were no statistically significant difference in the month-to-month fluctuations in admission volume between age groups. The dashed line represents the onset of the pandemic.
Objective: To determine how admission volumes and diagnoses changed longitudinally during the COVID-19 era for different age groups.
Design/Methods: This retrospective cohort study used the Pediatric Hospital Information System database to analyze inpatient admissions of children aged 1 day to 18 years (n= 1,624,755) across 45 Children’s Hospitals from 1/1/17 to 6/30/21. Birth hospitalizations and interhospital transfers were excluded. Admitting diagnoses were grouped using Clinical Classification Software Refined (CCSR) categories. Respiratory infections and mental health disorders were developed from related CCSR designations. Using binomial probability tests, admissions and diagnoses counts in the COVID-19 era (March 2020 - June 2021) were compared to the averaged counts from the same months from 2017 – 2019 (pre-COVID-19 era) to account for secular trends. Change over the pandemic was evaluated with multivariate linear regression adjusting for age group.
Results: There were small, statistically significant differences in demographic data between the pre- and post-pandemic cohorts, such as slightly increased proportion of patients who are White, female and self-paying. Overall, average monthly admissions declined by 25.3% in the COVID-19 era compared to the pre-pandemic period (Table 1), but this varied temporally over the duration of the pandemic for all age groups (Figure 1). Compared to newborns in our adjusted model, adolescents had a similar decline in their admissions over the duration of pandemic (0.55% difference, 95% CI: –5.29, 6.39). Other age groups experienced an 18.7 – 26.9% greater decline in admissions compared to newborns. In the 1,623,244 patients with a CCSR code, there was a 68.4% (p < 0.001) decrease in respiratory infections. Adolescents experienced a marked increase in mental health conditions (9.9%, p < 0.001) and eating disorders (72.4%, p < 0.001) (Figure 2).Conclusion(s): The overall decline seen in admissions during the COVID-19 era is driven by reduced cases of respiratory pathogens. In adolescents, this decline is counterbalanced by the dramatic increase in mental health conditions. Newborns continue to be mostly admitted for birth-related conditions, resulting in volume stability during the COVID-19 era.
Table 1: Admission volumes and top 5 most frequent CCSR categories, by age group
 Abbreviations: CCSR – Clinical Classification Software Refined.
 To obtain mean monthly admissions, counts are summed over the entire era (pre-pandemic or COVID) and then averaged over the number of months in that period. The % of monthly admissions is the observed count of a specific diagnosis divided by the average monthly admission for that age group and that era. *p < 0.05 for the comparison of the proportion of a given diagnoses within an age group in the pre- vs post-COVID-19 eras.
The inter-era difference ratios were calculated by averaged counts during the pandemic divided by averaged counts in pre-COVID-19 era. ^p < 0.05 for the difference in absolute admissions in the pre- vs post-COVID-19 eras. A ratio of 1 indicates no change in admission counts between eras. Ratio < 1 means that average counts were higher in the pre-pandemic era; a ratio > 1 means that average counts were higher during the pandemic.
Figure 1: Change in inpatient admissions during the COVID-19 era for all age groups
 *Indicates that p < 0.05. Percent change in admissions was calculated by difference in monthly admission counts during the COVID-19 era divided by the average monthly admission counts in the pre-COVID-19 era. A negative number indicates a decrease in admissions during the COVID-19 era. There were no statistically significant difference in the month-to-month fluctuations in admission volume between age groups. The dashed line represents the onset of the pandemic.