
Neonatal Fetal Nutrition & Metabolism
Category: Abstract Submission
Neonatal Fetal Nutrition & Metabolism II
 photo")
Gregory C. Valentine, MD, MED, FAAP (he/him/his)
Assistant Professor of Pediatrics, Division of Neonatology
University of Washington
Seattle, Washington, United States
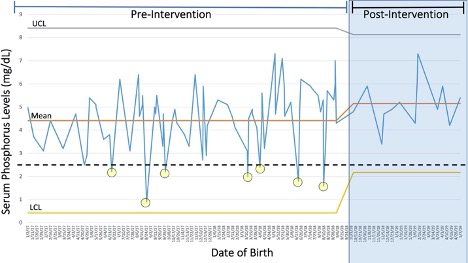 Process control chart demonstrating the changes occurring in serum phosphorus level within the first 24 hours by infant. From the mean, the UCL and LCL are +/- 3 SDs. LCL, lower control limit; UCL, upper control limit. Dashed line represents serum phosphorus level of 2.5 mEq/dL. Yellow circles highlight values that are considered severe hypophosphatemia as defined as < 2.5 mEq/dL.
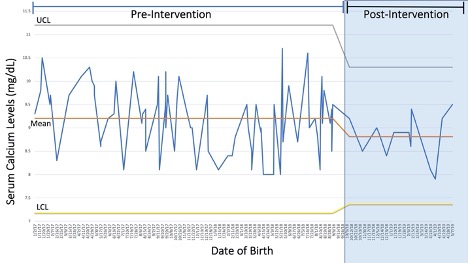 Process control chart demonstrating the changes occurring in serum calcium level within the first 24 hours by infant. From the mean, the UCL and LCL are +/- 3 SDs. LCL, lower control limit; UCL, upper control limit.