
Global Neonatal & Children's Health
Category: Abstract Submission
Global Child and Adolescent Health I

Nora Switchenko, MD
Assistant Professor
University of Alabama at Birmingham
Homewood, Alabama, United States
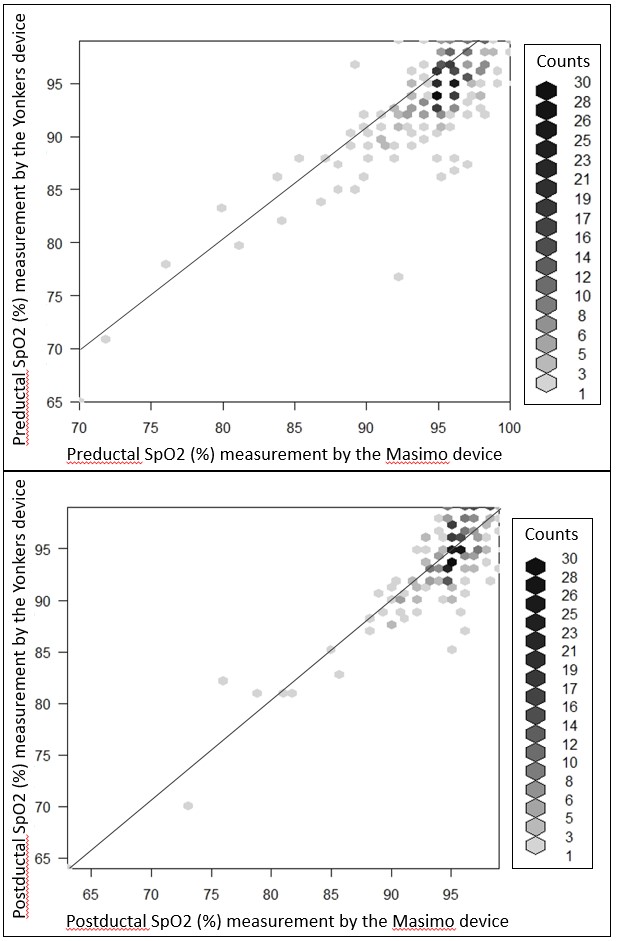 Scatter plots of Sp02 measurements with Masimo and Yonker devices. Points on the graph may represent more than one data point indicated by shading as described by the counts listed to the right of the graph. The line of identity is shown in both graphs.
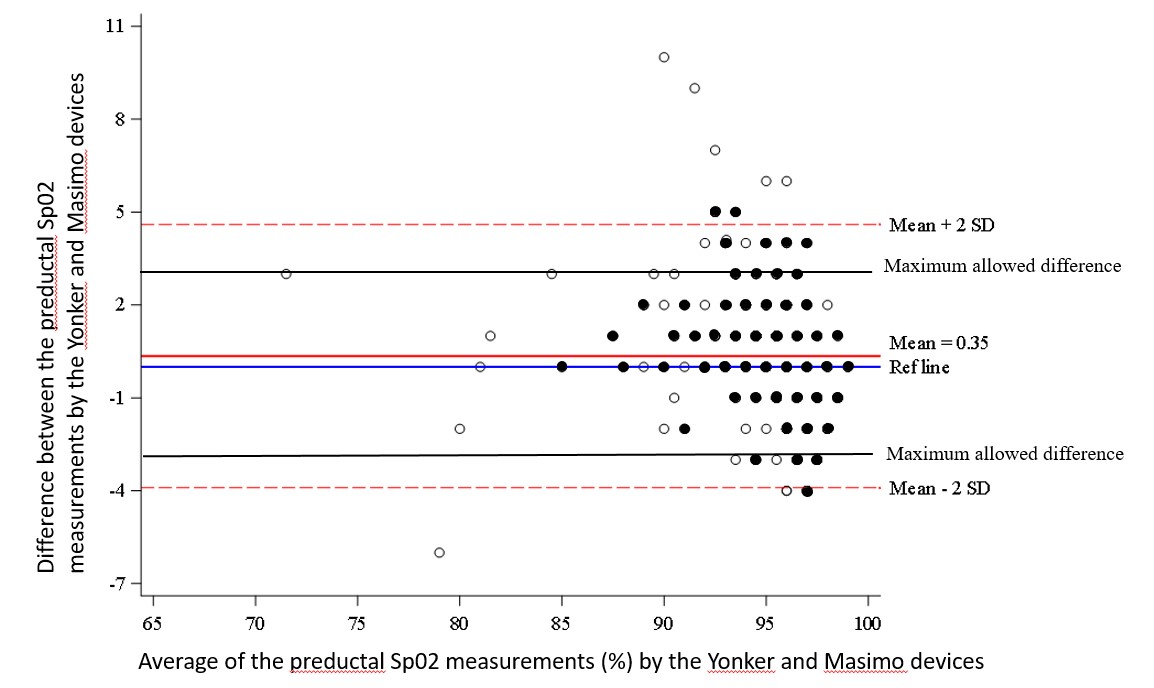 Bland Altman plot for the preductal SpO2 measurements by the Yonker and Masimo devices The limits of agreement (determined by ±2SD) are larger than the predetermined maximum allowed difference for the preductal Spo2 measurements. Dark circles represent more than one data point.