
Health Equity/Social Determinants of Health
Category: Abstract Submission
Health Equity/Social Determinants of Health I

James Bohnhoff, MD
General Academic Pediatrics Fellow
UPMC
University of Pittsburgh School of Medicine
Pittsburgh, Pennsylvania, United States
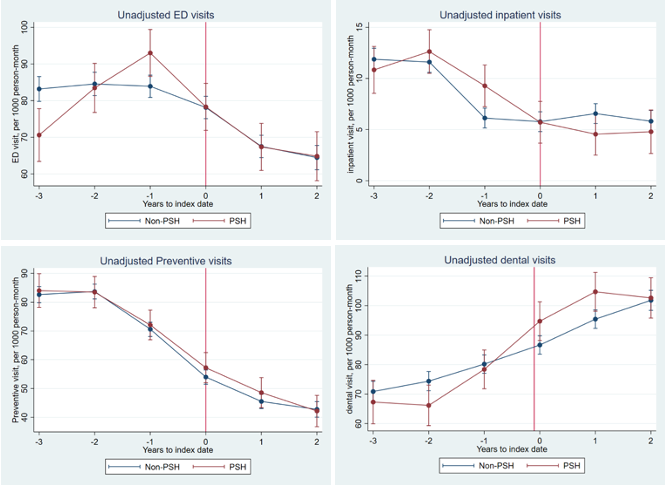 This figure plots unadjusted trends in our main utilization outcomes before and after entry into PSH (intervention cohort) and before and after the index date (comparison cohort). PSH entry or index date is represented as a red, vertical line. Negative numbers on the x-axis indicate years prior to PSH entry or the index date, positive numbers indicate years following PSH entry or the index date, and 0 indicates the year beginning upon PSH entry or the index date. Estimates plotted on the y-axis represent unadjusted mean rates of utilization per 1000 person-months. The error bars represent 95% confidence intervals which account for clustering within individuals.