Allergy, Immunology and Rheumatology
Category: Abstract Submission
Allergy, Immunology, and Rheumatology I
613 - Exogenous Inter-alpha inhibitor proteins (IAIPs) Enter Human Umbilical Vein Endothelial Cells (HUVEC) and Co-Localize with Cytoplasmic Elements
Saturday, April 23, 2022
3:30 PM - 6:00 PM US MT
Poster Number: 613
Publication Number: 613.200
Publication Number: 613.200
Kazuki Hatayama, Women & Infants Hospital of Rhode Island, providence, RI, United States; Xiaodi Chen, The Warren Alpert Medical School of Brown University, Providence, RI, United States; Yow-Pin Lim, ProThera Biologics, Inc., Providence, RI, United States; Barbara Stonestreet, Women & Infants Hospital of Rhode Island, Providence, RI, United States

Kazuki Hatayama, MD, PhD (he/him/his)
clinical fellowship
National Center for Child Health and Development, Tokyo, Japan
Tokyo, Tokyo, Japan
Presenting Author(s)
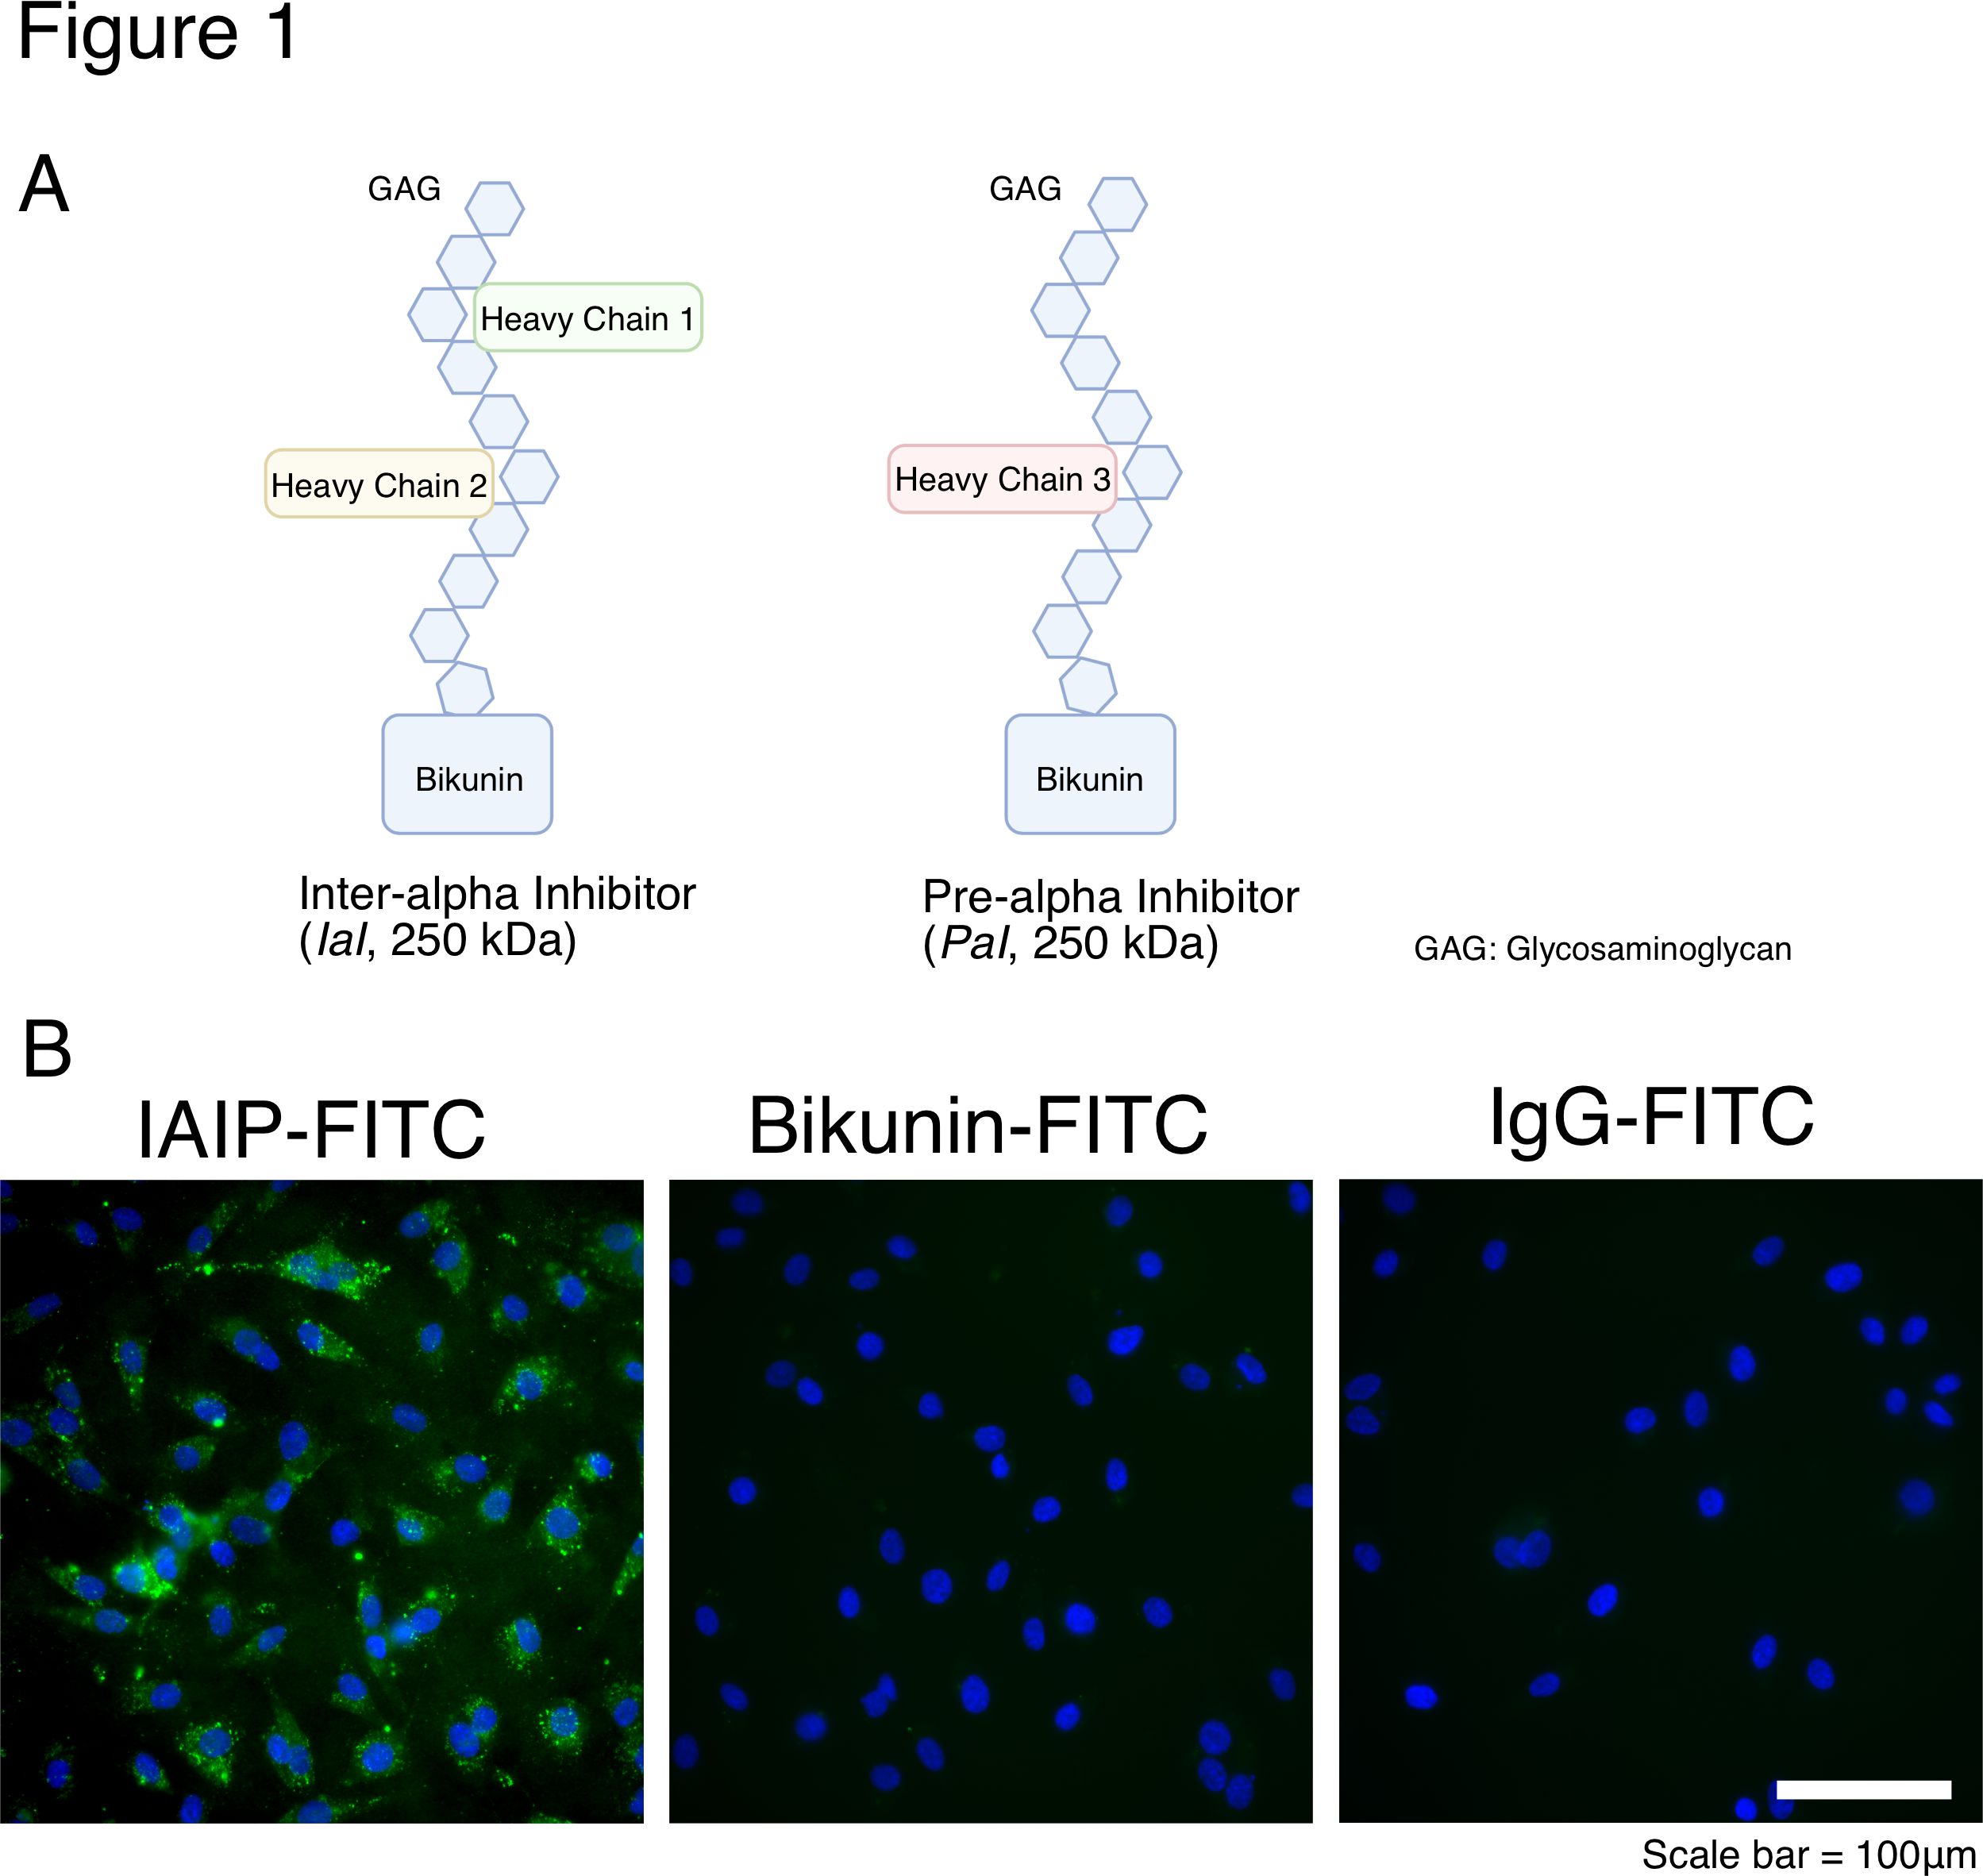
Background: Inter-alpha Inhibitor Proteins (IAIPs) are anti-inflammatory molecules, composed of heavy- and light-chains covalently linked by a glycosaminoglycan chain (Fig. 1A). The light chain called Bikunin has been used to treat patients with inflammatory disorders. IAIPs are involved in several inflammatory disorders in neonates, and we have shown that IAIPs are neuroprotective after exposure to hypoxic-ischemic brain injury. However, the ability of exogenous IAIPs to penetrate endothelial cells in vitro and their consequent localization in endothelial cells remain to be determined.
Objective: To determine the capacity of exogenous IAIPs to enter Human Umbilical Vein Endothelial Cells (HUVEC, EA.hy 926 cells) and their localization in the endothelial cells.
Design/Methods: EA.hy 926 cell line were cultured using Dulbecco’s modified Eagle medium (DMEM) supplemented with 10% fetal bovine serum, 5% L-glutamine and 1% penicillin/streptomycin in 5% CO2 at 37℃. After reaching confluence, cells were resuspended in 24 well flasks in DMEM and, cultured with serum free DMEM for 2 h and incubated with the following proteins: IAIPs-FITC, Bikunin-FITC, and IgG-FITC (negative control) for 24 h (Fig. 1B) in DMEM and incubated with IAIPs-FITC for different time intervals (1, 3, 6, 12 and 24 h, Fig. 2A). Five images were obtained from each well and the positive fluorescence of IAIP-FITC divided by the number of cells in each well for each time point (n=5, Fig. 2B). IAIP-FITC co-localization after the 24-h of incubation was investigated by immunocytochemistry (Fig. 3) in early endosomes (rab5), lysosome (lamp1), and peroxisomes (catalase). P < 0.05 was statistically significant.
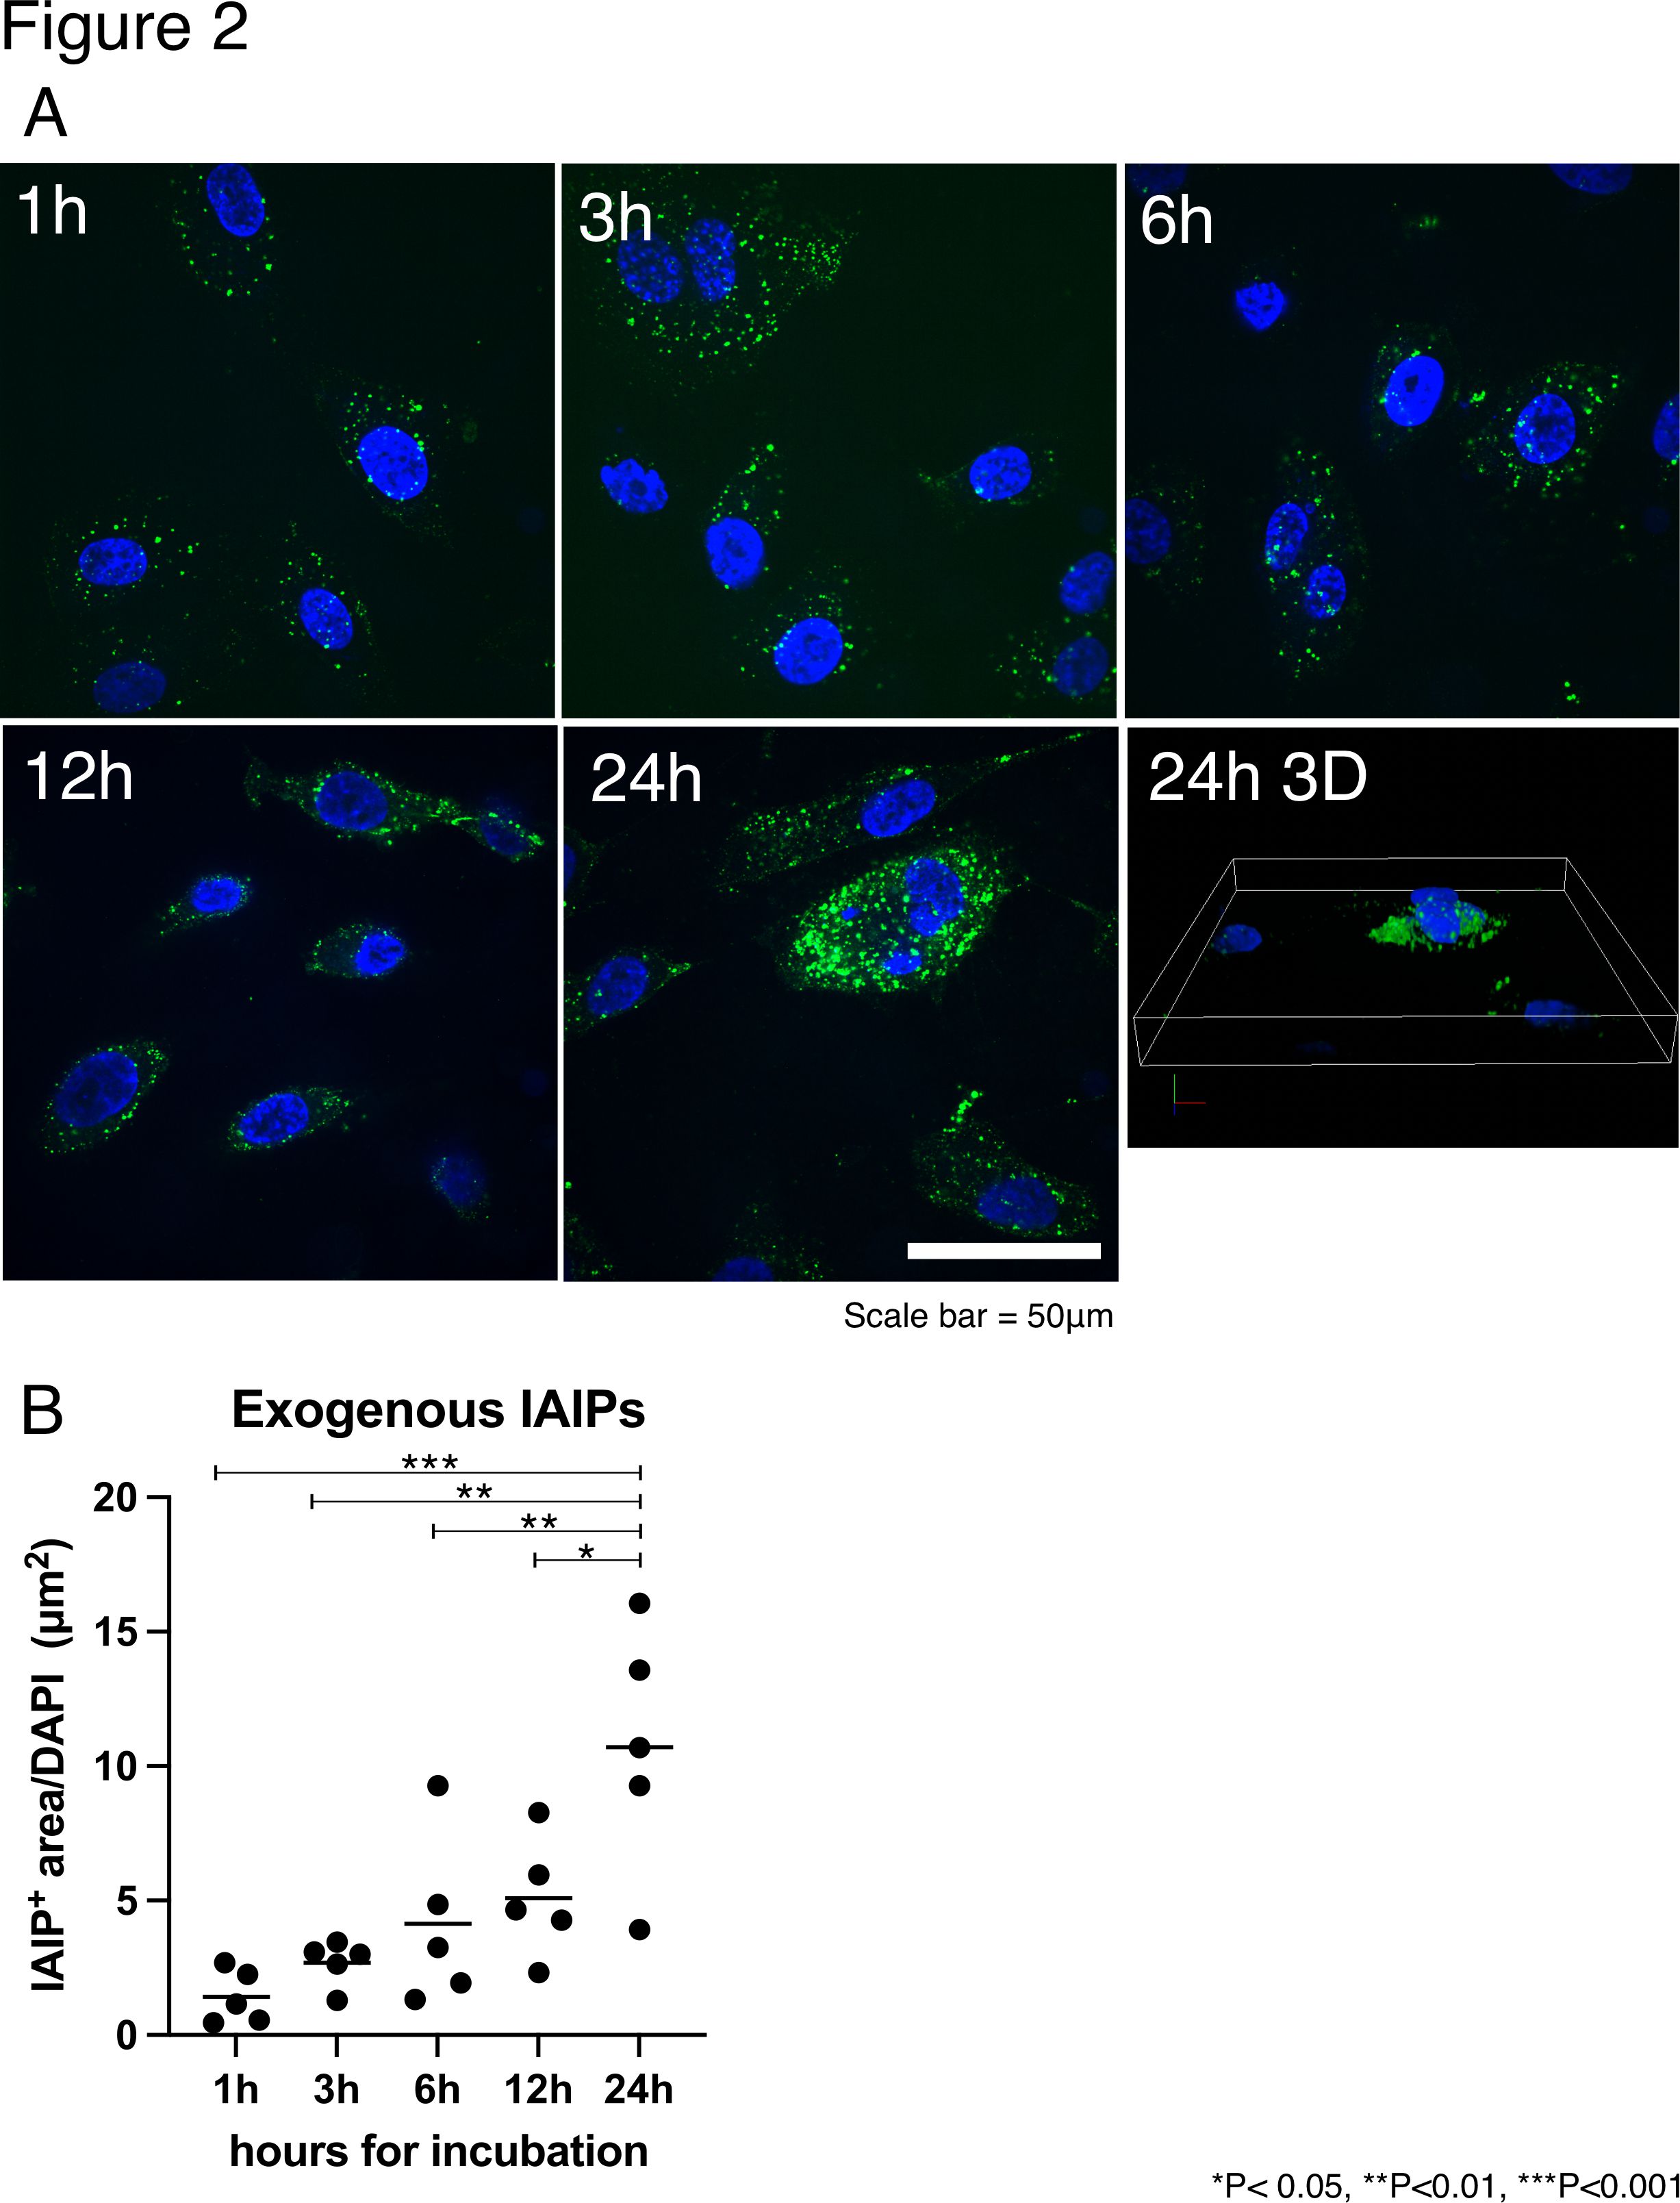
Results: IAIP-FITC was present within the EA.hy 926 cells, whereas Bikunin-FITC and IgG-FITC were not located within the cells after the 24 h incubation (Fig. 1B). Quantification of the fluorescence showed that the IAIP-FITC fluorescence per cell increased in time dependent manner (Figs. 2A and B). Exogenous IAIPs were mainly localized in the cytoplasm of the EA.hy 926 cells (Fig. 2A). IAIPs co-localized with early endosomes and peroxisomes, but not lysosomes (Fig. 3).Conclusion(s): Exogenous IAIPs entered EA.hy 926 cells in time dependent manner, but the light chain bikunin did not enter the cells. This finding implies that the heavy chains facilitate the entry of exogenous IAIPs into the EA.hy 926 cells. We conclude that exogenous IAIPs but not bikunin are able to enter EA.hy 926 cells and co-localize with subcellular cytoplasmic elements including endosomes and peroxisomes but not lysosomes.
Figure 1 IAIPs structure and localization of exogenous IAIP and bikunin in EA.hy926 cells (A) Schematic structure of two major Inter-alpha inhibitor proteins (IAIPs); inter-alpha inhibitor (IaI; 250kDa) and pre-alpha inhibitor (Pal; 125 kDa). IAIPs contain a glycosaminoglycan (GAG) backbone of chondroitin sulfate disaccharide repeats. IAIPs are composed of heavy chains and light (bikunin) chains, which are connected to the GAG backbone.
(B) Representative images for EA.hy926 cells incubated with IAIP-FITC, Bikunin-FITC and IgG-FITC (negative control) for 24 hours. Green fluorescence shows the existence of FITC inside cells.
Figure 2 The localization of exogenous IAIPs in HUVEC in different time points (A) Representative images for EA.hy926 cells incubated with IAIP-FITC for 1, 3, 6, 12, and 24 hours. Three-dimensional (3D) image of 24 hours is shown next to 24 hour image.
(B) The quantification of IAIP positive area divided by number of cells using ImageJ software. The results shown are the median with dot plot (n=5 for each time point).
Objective: To determine the capacity of exogenous IAIPs to enter Human Umbilical Vein Endothelial Cells (HUVEC, EA.hy 926 cells) and their localization in the endothelial cells.
Design/Methods: EA.hy 926 cell line were cultured using Dulbecco’s modified Eagle medium (DMEM) supplemented with 10% fetal bovine serum, 5% L-glutamine and 1% penicillin/streptomycin in 5% CO2 at 37℃. After reaching confluence, cells were resuspended in 24 well flasks in DMEM and, cultured with serum free DMEM for 2 h and incubated with the following proteins: IAIPs-FITC, Bikunin-FITC, and IgG-FITC (negative control) for 24 h (Fig. 1B) in DMEM and incubated with IAIPs-FITC for different time intervals (1, 3, 6, 12 and 24 h, Fig. 2A). Five images were obtained from each well and the positive fluorescence of IAIP-FITC divided by the number of cells in each well for each time point (n=5, Fig. 2B). IAIP-FITC co-localization after the 24-h of incubation was investigated by immunocytochemistry (Fig. 3) in early endosomes (rab5), lysosome (lamp1), and peroxisomes (catalase). P < 0.05 was statistically significant.
Results: IAIP-FITC was present within the EA.hy 926 cells, whereas Bikunin-FITC and IgG-FITC were not located within the cells after the 24 h incubation (Fig. 1B). Quantification of the fluorescence showed that the IAIP-FITC fluorescence per cell increased in time dependent manner (Figs. 2A and B). Exogenous IAIPs were mainly localized in the cytoplasm of the EA.hy 926 cells (Fig. 2A). IAIPs co-localized with early endosomes and peroxisomes, but not lysosomes (Fig. 3).Conclusion(s): Exogenous IAIPs entered EA.hy 926 cells in time dependent manner, but the light chain bikunin did not enter the cells. This finding implies that the heavy chains facilitate the entry of exogenous IAIPs into the EA.hy 926 cells. We conclude that exogenous IAIPs but not bikunin are able to enter EA.hy 926 cells and co-localize with subcellular cytoplasmic elements including endosomes and peroxisomes but not lysosomes.
Figure 1 IAIPs structure and localization of exogenous IAIP and bikunin in EA.hy926 cells
 (A) Schematic structure of two major Inter-alpha inhibitor proteins (IAIPs); inter-alpha inhibitor (IaI; 250kDa) and pre-alpha inhibitor (Pal; 125 kDa). IAIPs contain a glycosaminoglycan (GAG) backbone of chondroitin sulfate disaccharide repeats. IAIPs are composed of heavy chains and light (bikunin) chains, which are connected to the GAG backbone.
(B) Representative images for EA.hy926 cells incubated with IAIP-FITC, Bikunin-FITC and IgG-FITC (negative control) for 24 hours. Green fluorescence shows the existence of FITC inside cells.
Figure 2 The localization of exogenous IAIPs in HUVEC in different time points
 (A) Representative images for EA.hy926 cells incubated with IAIP-FITC for 1, 3, 6, 12, and 24 hours. Three-dimensional (3D) image of 24 hours is shown next to 24 hour image.
(B) The quantification of IAIP positive area divided by number of cells using ImageJ software. The results shown are the median with dot plot (n=5 for each time point).
