Neonatal Follow-up
Category: Abstract Submission
Neonatal Follow-up III
266 - Grade 3 School Performance Among Children Born Preterm: A Population-Based Cohort Study in Canada
Saturday, April 23, 2022
3:30 PM - 6:00 PM US MT
Poster Number: 266
Publication Number: 266.225
Publication Number: 266.225
DEEPAK LOUIS, Max Rady College of Medicine, Rady Faculty of Health Sciences, University of Manitoba, WINNIPEG, MB, Canada; Sapna Oberoi, CancerCare Manitoba, Winnipeg, MB, Canada; M. Florencia Ricci, Max Rady College of Medicine, Rady Faculty of Health Sciences, University of Manitoba, Winnipeg, MB, Canada; Christy Pylypjuk, Max Rady College of Medicine, Rady Faculty of Health Sciences, University of Manitoba, Winnipeg, MB, Canada; Ruben Alvaro, University of Manitoba, Winnipeg, MB, Canada; Mary Seshia, Max Rady College of Medicine, Rady Faculty of Health Sciences, University of Manitoba, Winnipeg, MB, Canada; Cecilia de Cabo, University of Manitoba, Winnipeg, MB, Canada; Diane Moddemann, Max Rady College of Medicine, Rady Faculty of Health Sciences, University of Manitoba, Winnipeg, MB, Canada; Lisa M. Lix, University of Manitoba, Winnipeg, MB, Canada; Allan Garland, Max Rady College of Medicine, Rady Faculty of Health Sciences, University of Manitoba, Winnipeg, MB, Canada; Chelsea Ruth, Max Rady College of Medicine, Rady Faculty of Health Sciences, University of Manitoba, Winnipeg, MB, Canada
.jpg)
Deepak Louis, MD, DM, MSc Candidate
Assistant Professor
Max Rady College of Medicine, Rady Faculty of Health Sciences, University of Manitoba
Winnipeg, Manitoba, Canada
Presenting Author(s)
Background: There is a paucity of population-based data on the elementary school performance of a contemporary cohort of preterm children.
Objective: To study the association between prematurity and grade 3 school performance in a cohort of children.
Design/Methods: A population-based retrospective cohort study in the province of Manitoba, Canada that included children born between 1999-2011 whose grade 3 school performance was routinely assessed by school teachers using numeracy and reading assessment tools developed by the Dept. of Education of Manitoba. A secondary sibling cohort was created consisting of preterm children and their term sibling closest in age.
Main Outcome Measures: i. 'Needs ongoing help' or 'outside the range' in two or more numeracy competencies in grade 3, ii. 'Needs ongoing help' or 'outside the range' in two or more reading competencies in grade 3. Multivariable logistic regression models were created to identify predictors of both primary outcomes; odds ratios (ORs) and 95% confidence intervals (CIs) were estimated.
Results: Of the 186,956 eligible children, 101,436 children [7187 preterm children (gestational age, median [IQR]: 35 weeks [34,36]) and 94,249 term children (40 weeks [39,40]) were included. Overall,19% of preterm children and 14% of term children had the numeracy outcome [unadjusted OR: 1.5; 95% CI: 1.4-1.6, p < 0.001] while 19% and 13% had the reading outcome respectively [OR: 1.5; 1.4-1.6, p < 0.001]. These differences showed a gestational age gradient. Gestational age [ < 28 weeks OR: 4.93; 3.46-7.03, 28-33 weeks OR: 1.72; 1.50-1.98, 34-36 weeks OR: 1.24; 1.15-1.34], male sex [OR: 1.11; 1.06-1.17], small for gestational age (SGA) [OR: 1.42; 1.33-1.52] and maternal medical and socio-demographic factors predicted both the numeracy and reading outcomes in the population model. In the sibling cohort, there were no differences in the outcomes except for reading. The predictors in the sibling model were prematurity < 34 weeks, male sex, SGA, and mother’s age at first delivery for the reading outcome while none of the variables were predictors of the numeracy outcome.Conclusion(s): In this population-based cohort, preterm children had poorer performance in grade 3 numeracy and reading than term children. However, this difference was not seen in the sibling cohort. Prematurity was an independent predictor of grade 3 outcomes.
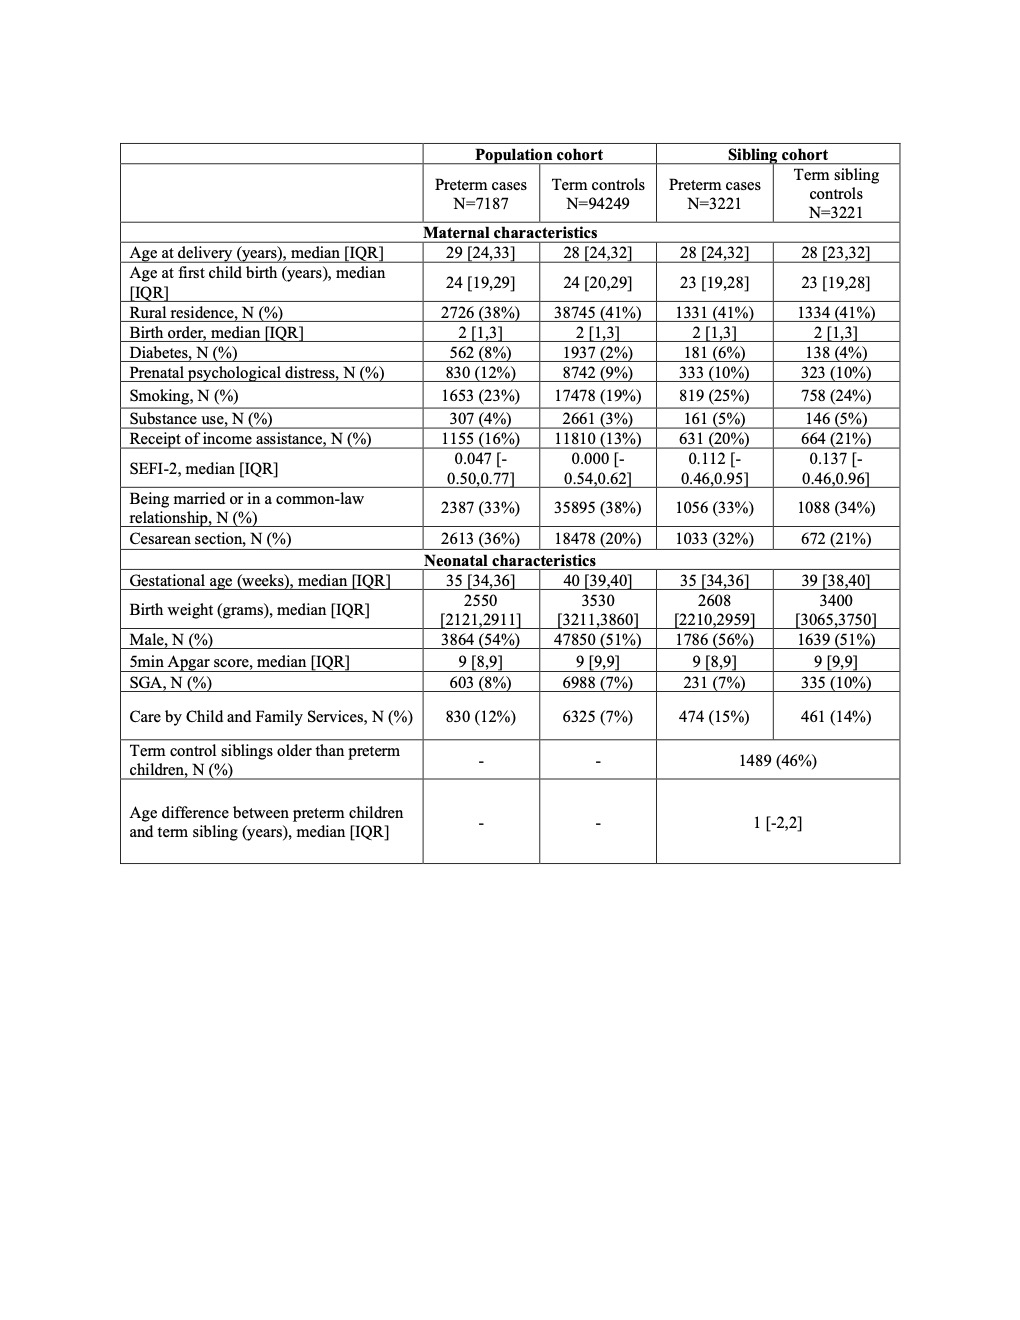
Table 1: Baseline characteristics of the population and the sibling cohorts IQR-interquartile range; SGA-small for gestational age; SEFI-2-Socioeconomic Factor Index-version 2 score.
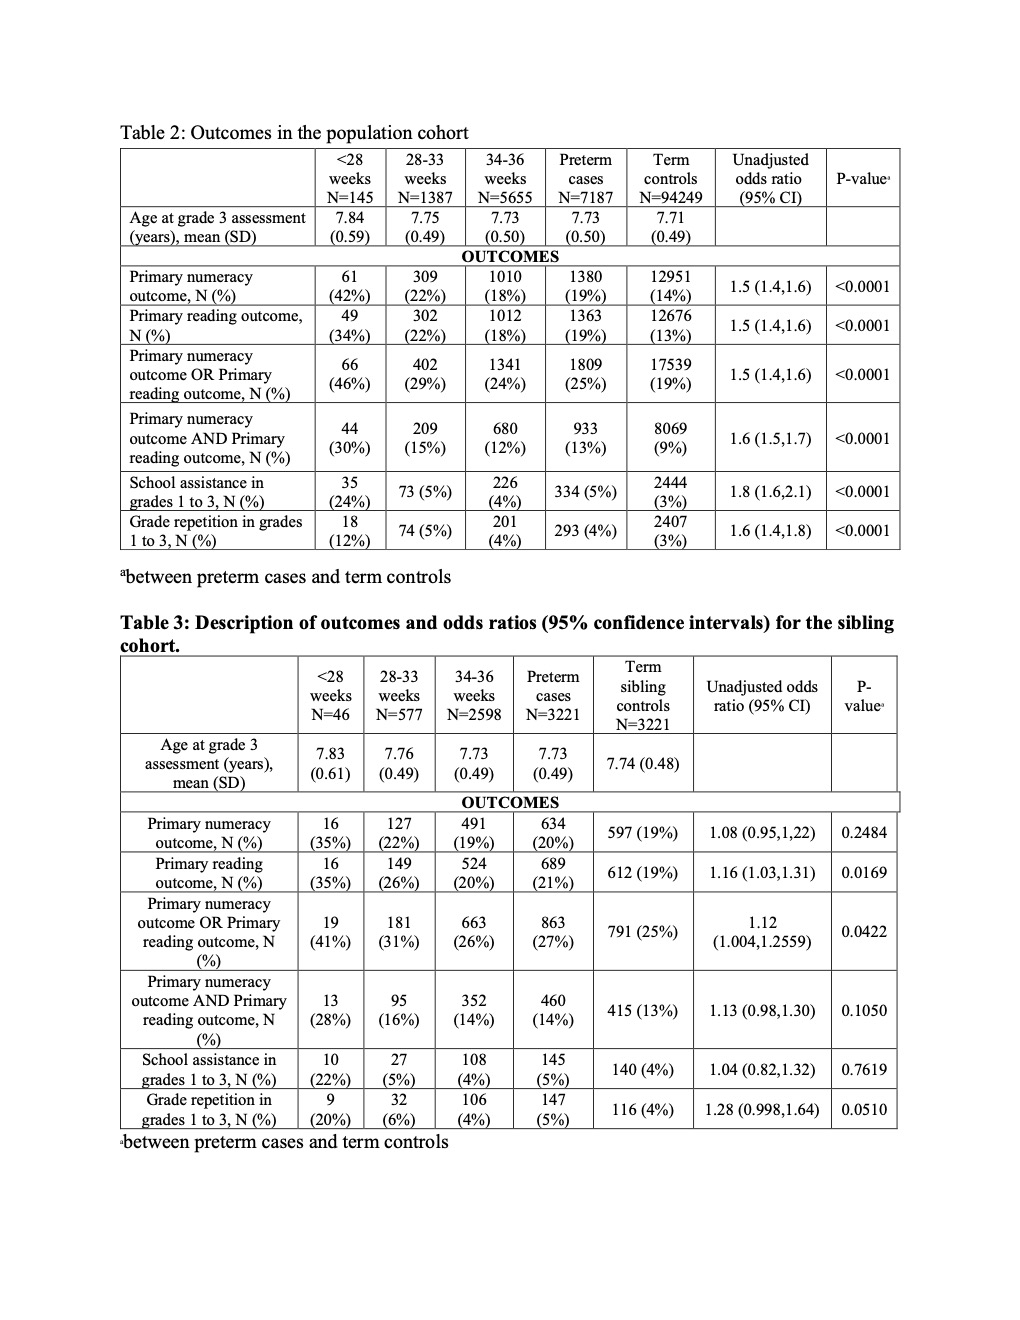
Description of outcomes and odds ratios (95% confidence intervals) for the population cohort (Table 2) and sibling cohort (Table 3) abetween preterm cases and term controls
Objective: To study the association between prematurity and grade 3 school performance in a cohort of children.
Design/Methods: A population-based retrospective cohort study in the province of Manitoba, Canada that included children born between 1999-2011 whose grade 3 school performance was routinely assessed by school teachers using numeracy and reading assessment tools developed by the Dept. of Education of Manitoba. A secondary sibling cohort was created consisting of preterm children and their term sibling closest in age.
Main Outcome Measures: i. 'Needs ongoing help' or 'outside the range' in two or more numeracy competencies in grade 3, ii. 'Needs ongoing help' or 'outside the range' in two or more reading competencies in grade 3. Multivariable logistic regression models were created to identify predictors of both primary outcomes; odds ratios (ORs) and 95% confidence intervals (CIs) were estimated.
Results: Of the 186,956 eligible children, 101,436 children [7187 preterm children (gestational age, median [IQR]: 35 weeks [34,36]) and 94,249 term children (40 weeks [39,40]) were included. Overall,19% of preterm children and 14% of term children had the numeracy outcome [unadjusted OR: 1.5; 95% CI: 1.4-1.6, p < 0.001] while 19% and 13% had the reading outcome respectively [OR: 1.5; 1.4-1.6, p < 0.001]. These differences showed a gestational age gradient. Gestational age [ < 28 weeks OR: 4.93; 3.46-7.03, 28-33 weeks OR: 1.72; 1.50-1.98, 34-36 weeks OR: 1.24; 1.15-1.34], male sex [OR: 1.11; 1.06-1.17], small for gestational age (SGA) [OR: 1.42; 1.33-1.52] and maternal medical and socio-demographic factors predicted both the numeracy and reading outcomes in the population model. In the sibling cohort, there were no differences in the outcomes except for reading. The predictors in the sibling model were prematurity < 34 weeks, male sex, SGA, and mother’s age at first delivery for the reading outcome while none of the variables were predictors of the numeracy outcome.Conclusion(s): In this population-based cohort, preterm children had poorer performance in grade 3 numeracy and reading than term children. However, this difference was not seen in the sibling cohort. Prematurity was an independent predictor of grade 3 outcomes.
Table 1: Baseline characteristics of the population and the sibling cohorts
 IQR-interquartile range; SGA-small for gestational age; SEFI-2-Socioeconomic Factor Index-version 2 score.
Description of outcomes and odds ratios (95% confidence intervals) for the population cohort (Table 2) and sibling cohort (Table 3)
 abetween preterm cases and term controls