
Neonatal Neurology: Clinical
Category: Abstract Submission
Neurology 4: Neonatal Neurology Preterm Clinical

Zachary A. Vesoulis, MD, MSCI
Assistant Professor
Washington University in St. Louis School of Medicine
St. Louis, Missouri, United States
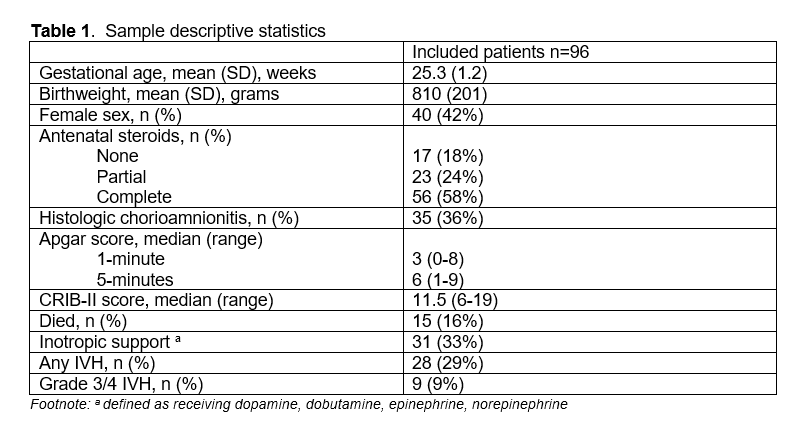 Sample descriptive statistics
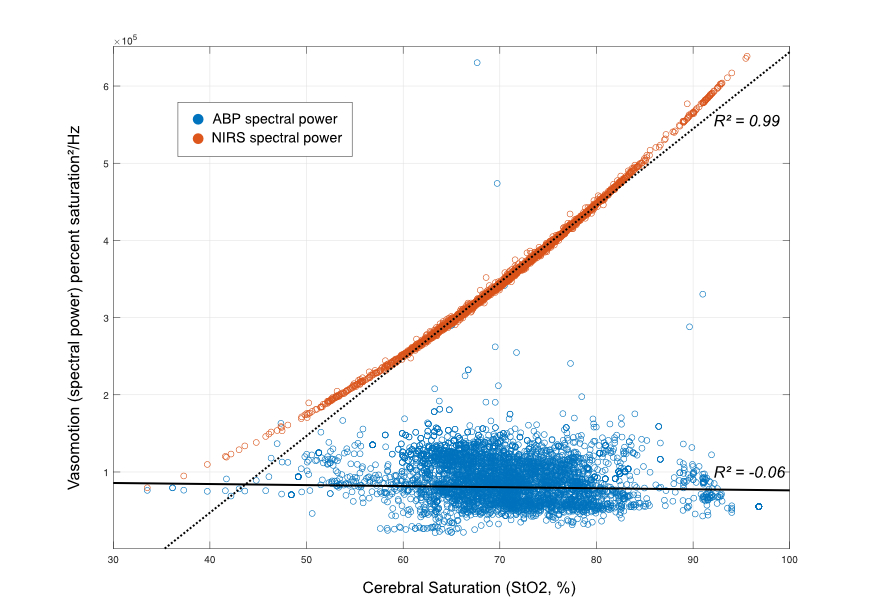 The strength of vasomotion in the MABP (blue) and cerebral NIRS (orange) signals is shown on the y-axis and is plotted against the mean cerebral saturation for each valid data window on the x-axis. There is essentially no relationship between systemic vasomotion and cerebral saturation (solid line, R2 = -0.06). In comparison, there is a very strong relationship between increasing cerebral saturation and increasing cerebrovascular vasomotion (dashed line, R2 = 0.99).