
Neonatal Pulmonology
Category: Abstract Submission
Neonatal Pulmonology III: Molecular Markers and Clinical Prediction Models/Outcomes

Maria M. Tovar-Hernandez, MS
Research Assistant
The University of Texas Health Science Center at San Antonio Joe R. and Teresa Lozano Long School of Medicine
San Antonio, Texas, United States
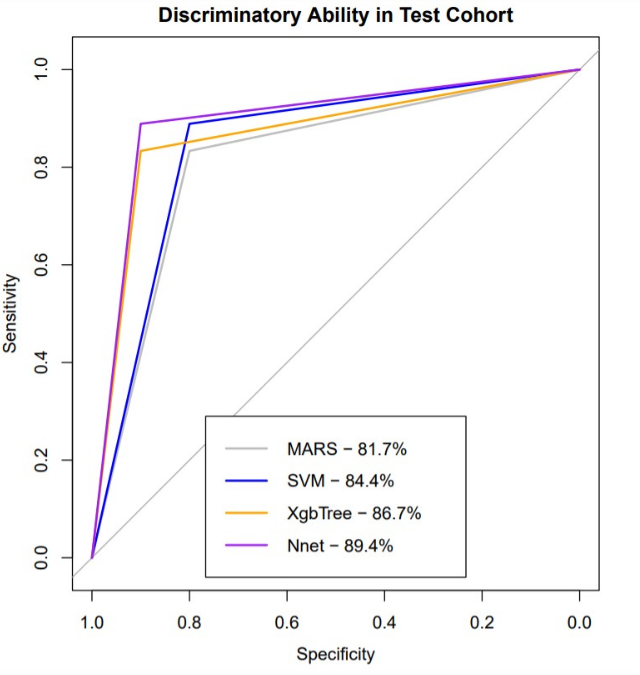 The graph shows that MARS model has the lowest AUC=81.7% (95% Cl, 65.9-97.5), followed by SVM with AUC=84.4% (95% Cl, 69.4-99.5), Xgb Tree with AUC=86.7% (95% Cl, 73.5-99.9), and the Nnet has the highest AUC=89.4% (95% Cl, 77.1-100). Area Under the Curve (AUC), Multivariate Adaptative Regression Splines (MARS), Support Vector Machine (SVM), eXtreme, Gradient Boosting Tree (Xgb Tree), Neural Networks (Nnet).