Critical Care
Category: Abstract Submission
Critical Care III
108 - Development of a clinical dashboard to illustrate reductions in opioid and sedative exposure following quality improvement initiatives in critically ill children
Sunday, April 24, 2022
3:30 PM - 6:00 PM US MT
Poster Number: 108
Publication Number: 108.307
Publication Number: 108.307
Gina DeMasellis, University of Colorado School of Medicine, Aurora, CO, United States; Pamela D. Reiter, Children's Hospital Colorado, denver, CO, United States; Carter Smith, Children's Hospital Colorado, Denver, CO, United States; Jane Bundy, Children's Hospital Colorado, Aurora, CO, United States; Jaime LaVelle, Children's Hospital Colorado, Aurora, CO, United States; Lalit Bajaj, University of Colorado Denver, Denver, CO, United States
- GD
Gina DeMasellis, MD
Assistant Professor
University of Colorado School of Medicine
Aurora, Colorado, United States
Presenting Author(s)
Background: Since 2015, our pediatric intensive care unit (PICU) has enacted quality improvement (QI) initiatives to reduce opioid and benzodiazepine (BZD) exposure in mechanically ventilated (MV) patients. However, we lacked an accurate, granular, and automatic extraction tool to leverage databases and provide a visual and interactive dashboard to demonstrate trends over time and provide feedback regarding these initiatives.
Objective: To describe the creation of an interactive visual dashboard using historic patient-level opioid and BZD exposure data.
Design/Methods: Institutional stakeholders, clinical effectiveness experts, analytics/coding specialists, and a local electronic medical record (EMR) specialist met monthly to develop the data dictionary, dashboard metrics, data extraction elements, design features and visual reporting options. Target population included MV children admitted to the PICU between 2015 and 2020. Data extracted from the EMR was exported into Tableau Software for dashboard build. After initial dashboard development, end-users tested the usability and flexibility of data visualization. Dashboard modifications were tested using a small cohort of patients. Fidelity of data was tested by selecting random patients for manual chart review. Outlier data was automatically chosen for manual validation. Following cohort success, the dashboard was retrospectively applied to the target patient population. Finally, all data from Tableau was exported into Excel to allow for increased granularity of exposure and transformation of opioid exposure into morphine equivalents (ME).
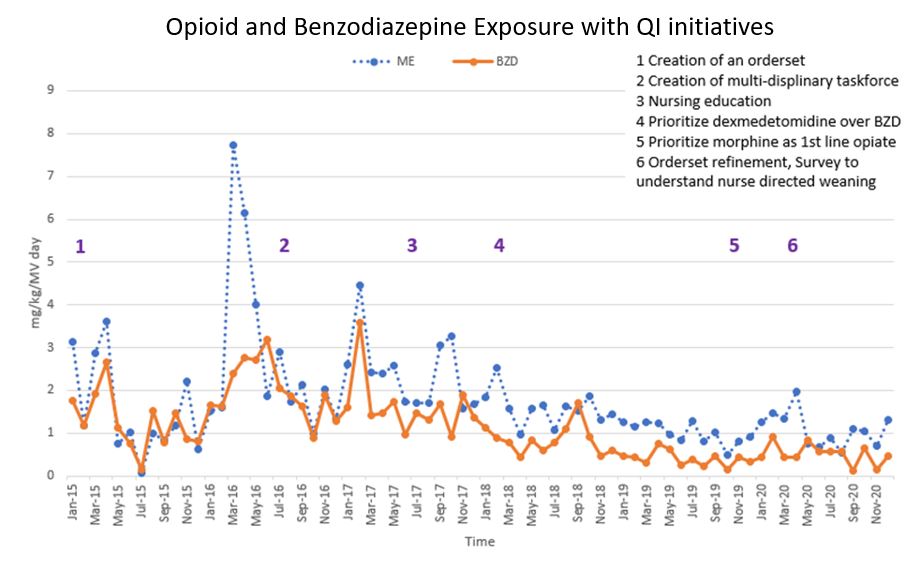
Results: Development of this clinical dashboard required 1-year to build, an additional 6 months to test and requires routine maintenance to ensure appropriate data capture. Eighty patients were used in the validation phase and then the dashboard was applied to the target population. The table illustrates patient characteristics of the target population provided by our Virtual Pediatric Systems, LLC database. Transposition of QI initiative dates onto dashboard data provided insight into the impact of initiatives (Figure). Dashboard filters and analytical features were added to allow examination of patient subgroups and further data exploration.Conclusion(s): We developed and implemented a reliable clinical dashboard to display opioid and BZD exposure trends following QI initiatives.
Characteristics of Mechanically Ventilated Patients per Year.jpg) Data obtained from our VPS database.
Data obtained from our VPS database.
Decreasing Trends in Opioid and Benzodiazepine Exposure in Mechanically Ventilated Patients with QI Initiatives Six quality improvement initiatives implemented in 2015-2020 resulted in decreased exposure to opioids and benzodiazepines in mechanically ventilated pediatric patients.
Objective: To describe the creation of an interactive visual dashboard using historic patient-level opioid and BZD exposure data.
Design/Methods: Institutional stakeholders, clinical effectiveness experts, analytics/coding specialists, and a local electronic medical record (EMR) specialist met monthly to develop the data dictionary, dashboard metrics, data extraction elements, design features and visual reporting options. Target population included MV children admitted to the PICU between 2015 and 2020. Data extracted from the EMR was exported into Tableau Software for dashboard build. After initial dashboard development, end-users tested the usability and flexibility of data visualization. Dashboard modifications were tested using a small cohort of patients. Fidelity of data was tested by selecting random patients for manual chart review. Outlier data was automatically chosen for manual validation. Following cohort success, the dashboard was retrospectively applied to the target patient population. Finally, all data from Tableau was exported into Excel to allow for increased granularity of exposure and transformation of opioid exposure into morphine equivalents (ME).
Results: Development of this clinical dashboard required 1-year to build, an additional 6 months to test and requires routine maintenance to ensure appropriate data capture. Eighty patients were used in the validation phase and then the dashboard was applied to the target population. The table illustrates patient characteristics of the target population provided by our Virtual Pediatric Systems, LLC database. Transposition of QI initiative dates onto dashboard data provided insight into the impact of initiatives (Figure). Dashboard filters and analytical features were added to allow examination of patient subgroups and further data exploration.Conclusion(s): We developed and implemented a reliable clinical dashboard to display opioid and BZD exposure trends following QI initiatives.
Characteristics of Mechanically Ventilated Patients per Year
.jpg) Data obtained from our VPS database.
Data obtained from our VPS database.Decreasing Trends in Opioid and Benzodiazepine Exposure in Mechanically Ventilated Patients with QI Initiatives
 Six quality improvement initiatives implemented in 2015-2020 resulted in decreased exposure to opioids and benzodiazepines in mechanically ventilated pediatric patients.