
Neonatal-Perinatal Health Care Delivery: Practices and Procedures
Category: Abstract Submission
Neonatal-Perinatal Health Care Delivery: Practices and Procedures - Modeling and Prediction
 photo")
Brynne A. Sullivan, MD, MSCR (she/her/hers)
Assistant Professor
University of Virginia
Charlottesville, Virginia, United States
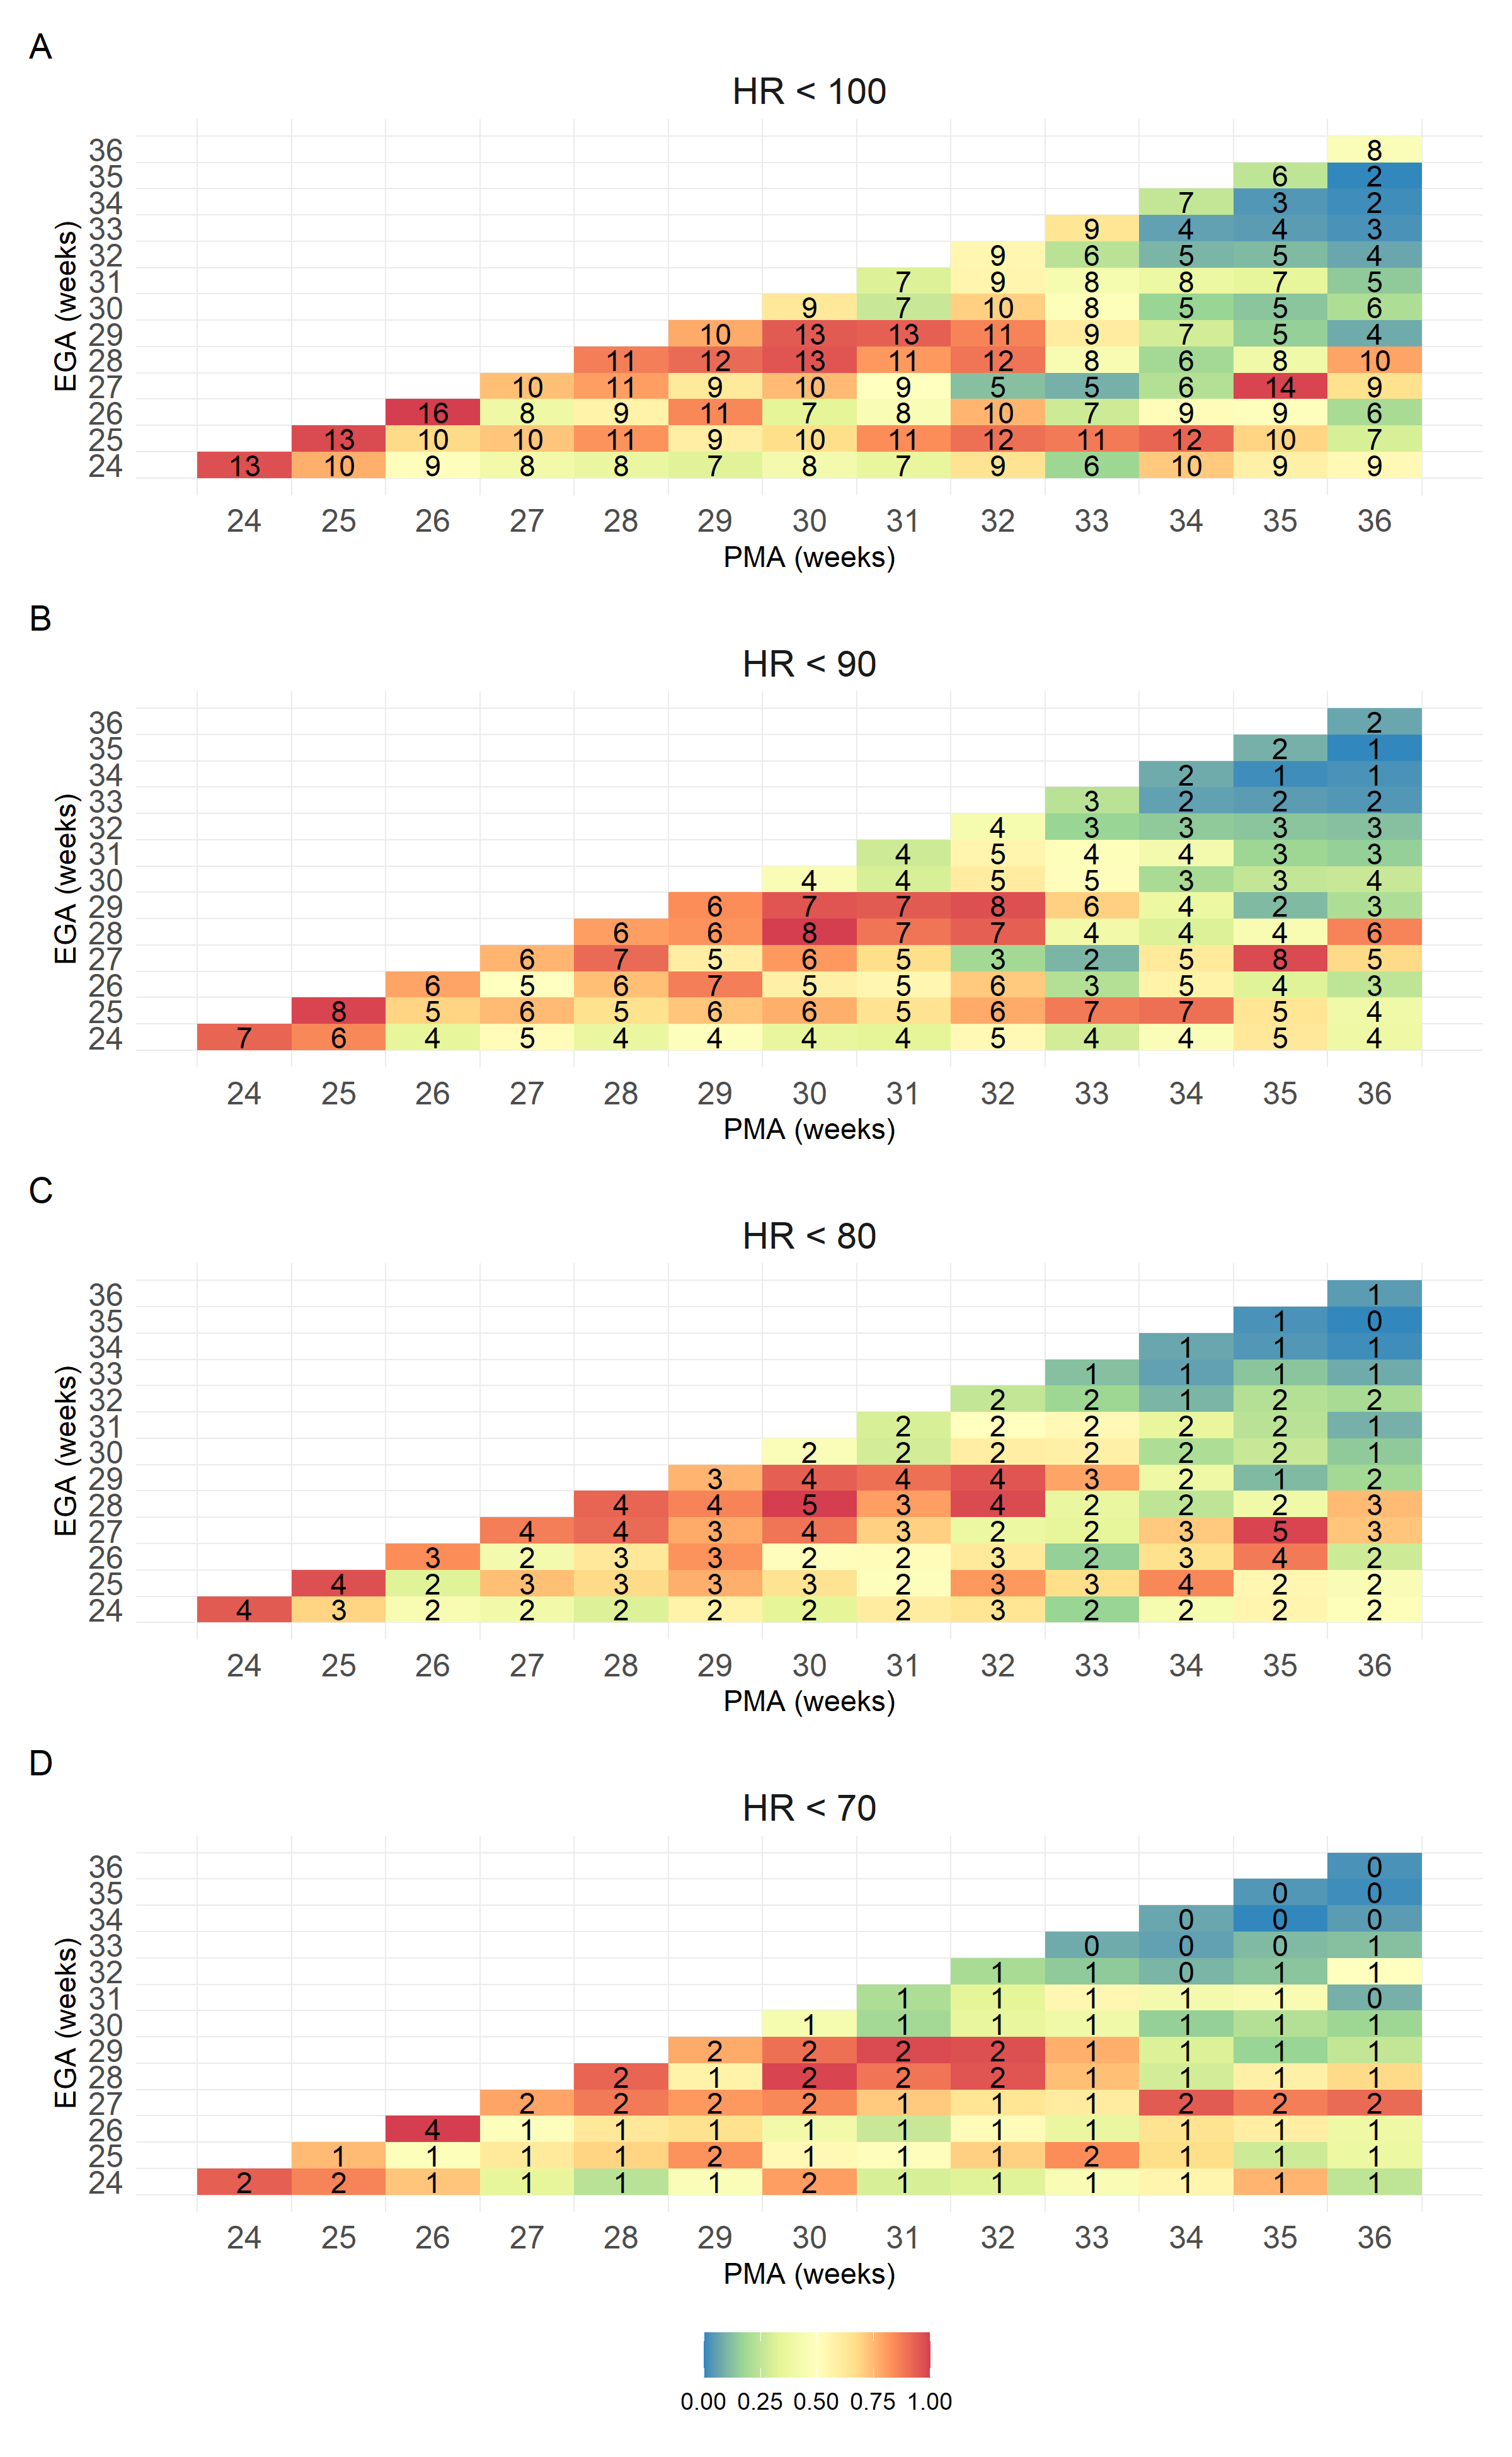 Heatmaps of the number of bradycardias per day of data by estimated gestational age (EGA, y-axis) and post-menstrual age (PMA, x-axis) at four alarm thresholds: < 100bpm, < 90bpm, < 80bpm, < 70bpm. The color gradient represents bradycardia events per day of data as a percentile in each panel, representing the scale for each of the four thresholds. Numbers in each tile represent the median bradycardia rate per day of data.
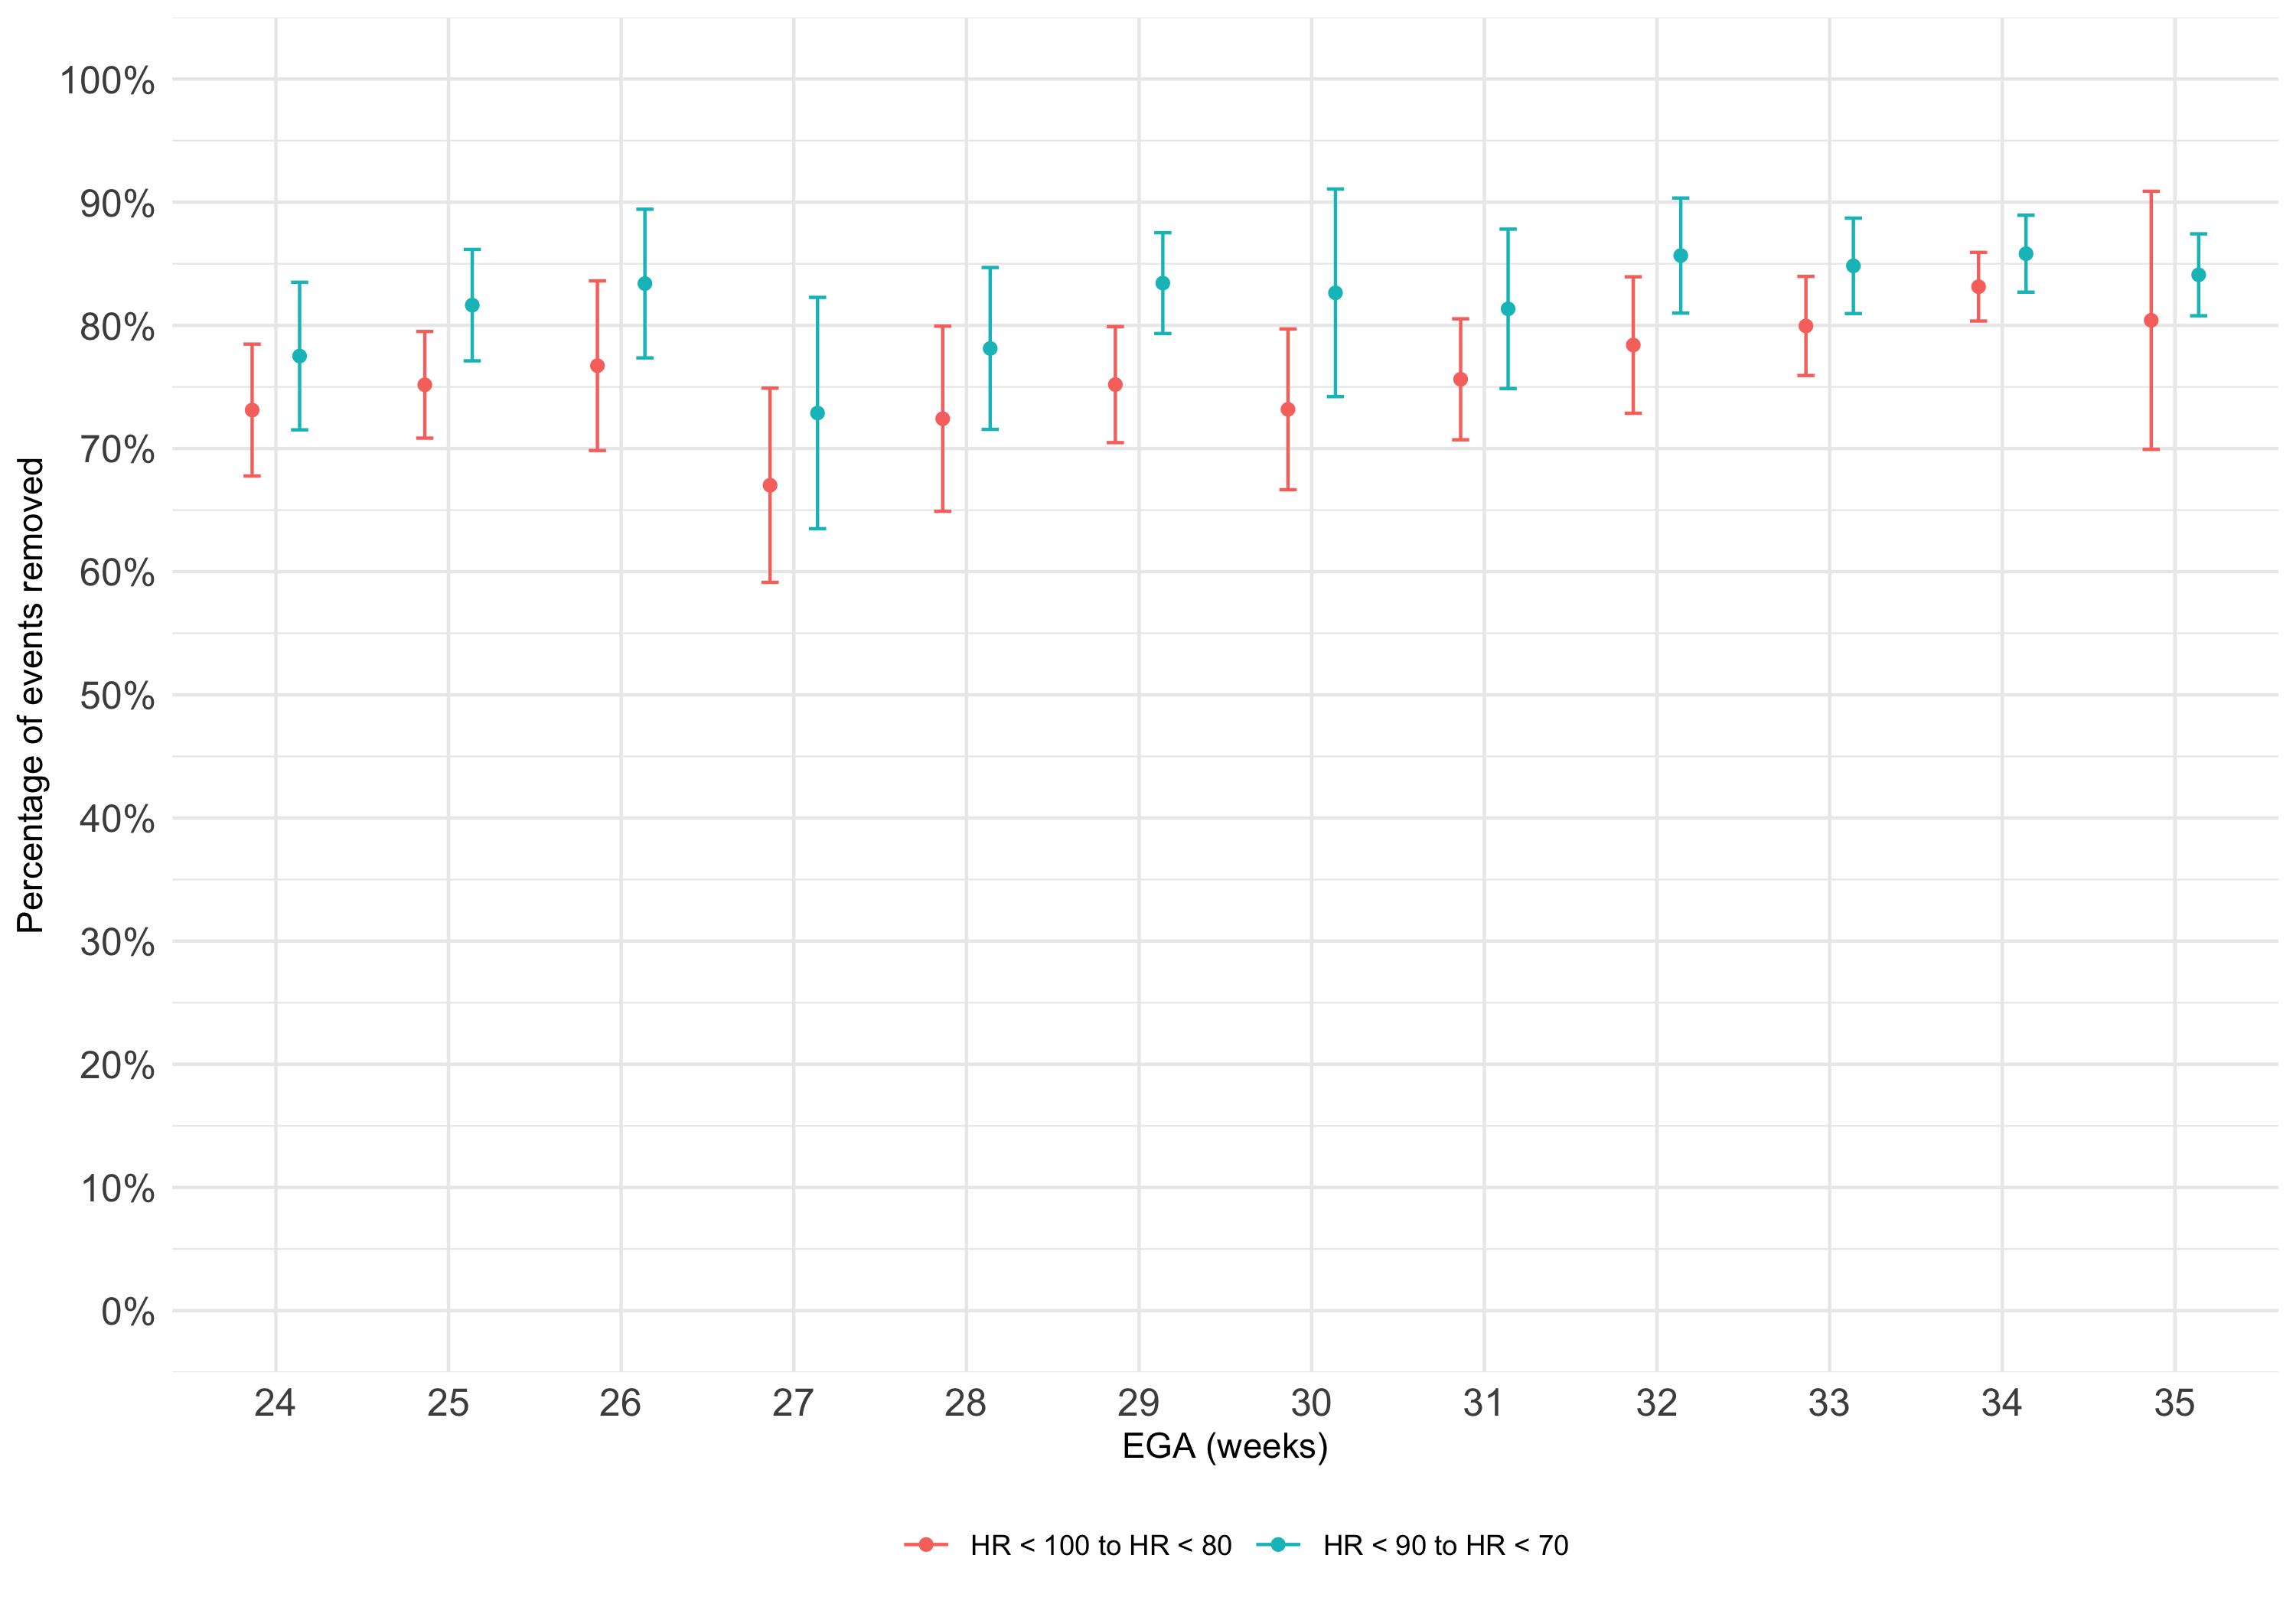 Percent reduction in hypothetical alarms per day of data when the threshold is dropped 20 bpm. The points represent the mean percent of hypothetical bradycardia alarms eliminated by decreasing the HR threshold from HR < 100 bpm to < 80 bpm (red) and from HR < 90 bpm to < 70 bpm (blue) and the error bars show the 95% confidence intervals.