Nephrology: Clinical
Category: Abstract Submission
Nephrology III: General Nephrology and Dialysis
55 - Should we go with the flow? predicting response to Rituximab among patients with Nephrotic syndrome using flow cytometry immunophenotyping, a single center pilot study
Sunday, April 24, 2022
3:30 PM - 6:00 PM US MT
Poster Number: 55
Publication Number: 55.340
Publication Number: 55.340
Daniella Levy Erez, SCMCI, kiriat ono, HaMerkaz, Israel; Kelly Maurer, Children's Hospital of Philadelphia, Philadelphia, PA, United States; Arielle Swenson, Childrens Hospital of Philadelphia, Philadelphia, PA, United States; Amy Strong, Childrens Hospital of Philadelphia, Philadelphia, PA, United States; Abigail R. Smith, Arbor Research Collaborative for Health, Ann Arbor, MI, United States; Sarah A. Mansfield, Arbor Research Collaborative for Health, Dexter, MI, United States; Aliya Edwards, Childrens Hospital of Philadelphia, Philadelphia, PA, United States; Jarcy Zee, Childrens Hospital of Philadelphia, Philadelphia, PA, United States; Kevin E. Meyers, The Children's Hospital of Philadelphia and University of Pennsylvania, Drexel Hill, PA, United States; Kathleen Sullivan, Children's Hospital of Philadelphia, Philadlephia, PA, United States
- DL
Daniella Levy Erez, MD, MTR (she/her/hers)
Schneider Children’s Medical Center Israel
Petach Tiqva, HaMerkaz, Israel
Presenting Author(s)
Background: First line treatment for idiopathic nephrotic syndrome (NS) in children and adults is glucocorticoid therapy. However, limited therapeutic options exist for patients with steroid resistant (SRNS) or steroid dependent NS (SDNS). Rituximab is one of a few alternative regimens. Given the risks associated with Rituximab therapy and the possibility of inefficacy, coupled with the poor understanding of the mechanism of action, there is a need to find novel biomarkers to predict which patients will respond best to Rituximab.
Objective: Explore the lymphocyte profile pre- and post-rituximab infusion among children with NS to identify novel treatment response biomarkers.
Design/Methods: Thirty children were enrolled in a prospective single center pilot study prior to rituximab treatment at the Children’s Hospital of Philadelphia. Blood samples were collected pre-rituximab and 1-2 weeks after rituximab and analyzed using flow cytometry (FC) to detect the subpopulations of white blood cells, specifically lymphocytes. Remission was the outcome of interest defined as urine protein creatinine ratio below 0.3 g/g for those not in remission at the time of rituximab initiation. Among participants with SSNS or SDNS who received rituximab after entering remission, duration of remission was evaluated. Univariate Cox models were used to estimate the effects of lymphocyte profile labs on the probability of remission. All p-values were corrected for multiple comparisons using the false discovery rate method of Benjamini and Hochberg.
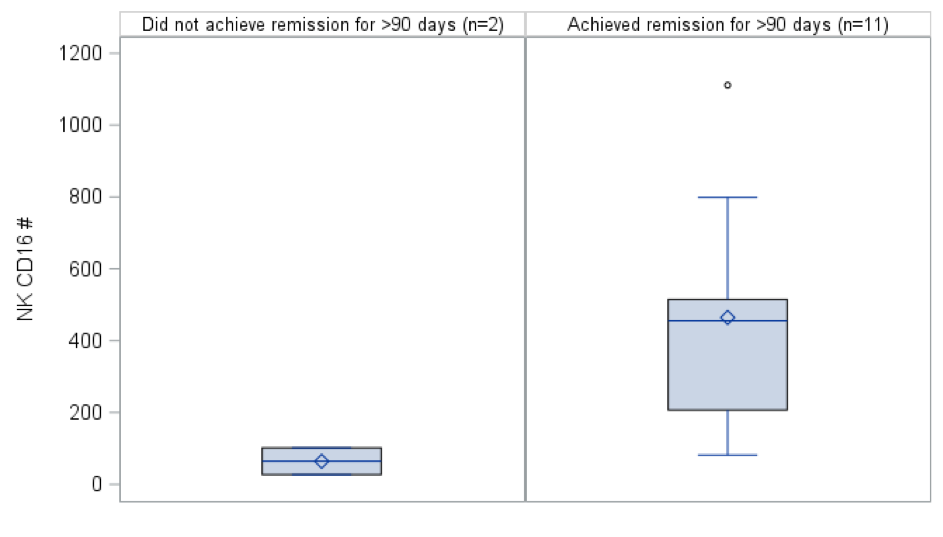
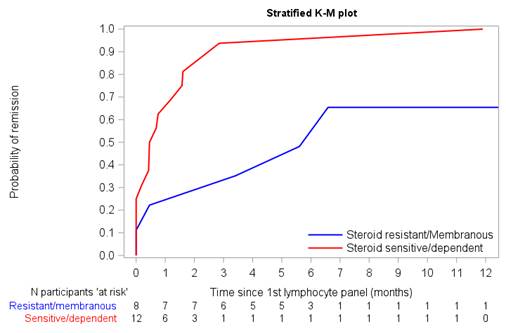
Results: Median (interquartile range) age was 12 (8-15) yrs., and 20 (65%) children were male. Six (23%) patients were diagnosed with SRNS, 20 (66%) had SSNS and 4 (13%) had membranous nephropathy (MN). Remission was higher among SSNS/SDNS vs SRNS/MN patients ( Figure 1). A higher number and percent of NK CD16 cells were associated with a higher probability of achieving remission (HR=1.03 per 10, p=0.07 and HR=1.17, p=0.02, respectively). Mean NK CD16 cell count was higher among SSNS/SDNS patients who achieved remission for >90 days vs. those who did not (465 vs. 64, Figure 2). High hazard ratios associated with remission were noted with elevated T helper follicular cells (HR=1.38), although given the small numbers the p-values were not significant. Conclusion(s): Flow cytometry prior to rituximab therapy has the potential to predict response to rituximab with evidence of a higher NK CD16 positive count associated with a higher probability of responding. A larger study is needed to validate these promising findings.
Figure 1: Natural killer cells CD16 positive in SSNS/SDNS patients Box plots descriptively compare NK CD16 positive counts pre-rituximab between those who achieved remission for at least 90 days vs. those who did not achieve remission or only achieved remission for ≤90 days for SSNS/SDNS patients.
Figure 1: Time to remission comparing SRNS/MN and SSNS/SDNS patients Kaplan Meier curve comparing SRNS/MN and SSNS/SDNS remission probability over time. Higher remission rates with a shorter time to remission were noted among patients with SSNS/SDNS (red) compared to patients with SRNS/MN (blue).
Objective: Explore the lymphocyte profile pre- and post-rituximab infusion among children with NS to identify novel treatment response biomarkers.
Design/Methods: Thirty children were enrolled in a prospective single center pilot study prior to rituximab treatment at the Children’s Hospital of Philadelphia. Blood samples were collected pre-rituximab and 1-2 weeks after rituximab and analyzed using flow cytometry (FC) to detect the subpopulations of white blood cells, specifically lymphocytes. Remission was the outcome of interest defined as urine protein creatinine ratio below 0.3 g/g for those not in remission at the time of rituximab initiation. Among participants with SSNS or SDNS who received rituximab after entering remission, duration of remission was evaluated. Univariate Cox models were used to estimate the effects of lymphocyte profile labs on the probability of remission. All p-values were corrected for multiple comparisons using the false discovery rate method of Benjamini and Hochberg.
Results: Median (interquartile range) age was 12 (8-15) yrs., and 20 (65%) children were male. Six (23%) patients were diagnosed with SRNS, 20 (66%) had SSNS and 4 (13%) had membranous nephropathy (MN). Remission was higher among SSNS/SDNS vs SRNS/MN patients ( Figure 1). A higher number and percent of NK CD16 cells were associated with a higher probability of achieving remission (HR=1.03 per 10, p=0.07 and HR=1.17, p=0.02, respectively). Mean NK CD16 cell count was higher among SSNS/SDNS patients who achieved remission for >90 days vs. those who did not (465 vs. 64, Figure 2). High hazard ratios associated with remission were noted with elevated T helper follicular cells (HR=1.38), although given the small numbers the p-values were not significant. Conclusion(s): Flow cytometry prior to rituximab therapy has the potential to predict response to rituximab with evidence of a higher NK CD16 positive count associated with a higher probability of responding. A larger study is needed to validate these promising findings.
Figure 1: Natural killer cells CD16 positive in SSNS/SDNS patients
 Box plots descriptively compare NK CD16 positive counts pre-rituximab between those who achieved remission for at least 90 days vs. those who did not achieve remission or only achieved remission for ≤90 days for SSNS/SDNS patients.
Figure 1: Time to remission comparing SRNS/MN and SSNS/SDNS patients
 Kaplan Meier curve comparing SRNS/MN and SSNS/SDNS remission probability over time. Higher remission rates with a shorter time to remission were noted among patients with SSNS/SDNS (red) compared to patients with SRNS/MN (blue).